Fluorescence Cross Correlation Spectroscopy (FCCS)
A guide to fluorescence cross-correlation spectroscopy
Table of Contents
What is fluorescence cross-correlation spectroscopy (FCCS)?
Fluorescence cross-correlation spectroscopy (FCCS) facilitates the quantitative analysis of co-diffusing fluorescently labelled biomolecules. By monitoring intensity fluctuations within a precise observation volume, FCCS builds upon the high sensitivity of FCS to track two distinct species simultaneously.
How does fluorescence cross-correlation spectroscopy work?
Like FCS, measurements are performed by tightly focusing a laser beam through a high numerical aperture objective to generate a diffraction-limited confocal volume, generally in the order of 0.1–1 femtolitre. Fluorescently labelled molecules diffuse stochastically through this volume, and their transient presence results in detectable bursts of photons. FCCS records the individual fluctuations of photons in both colour channels simultaneously, enabling detection of orthogonally labelled co-diffusing molecules, alongside single molecules diffusing independently.
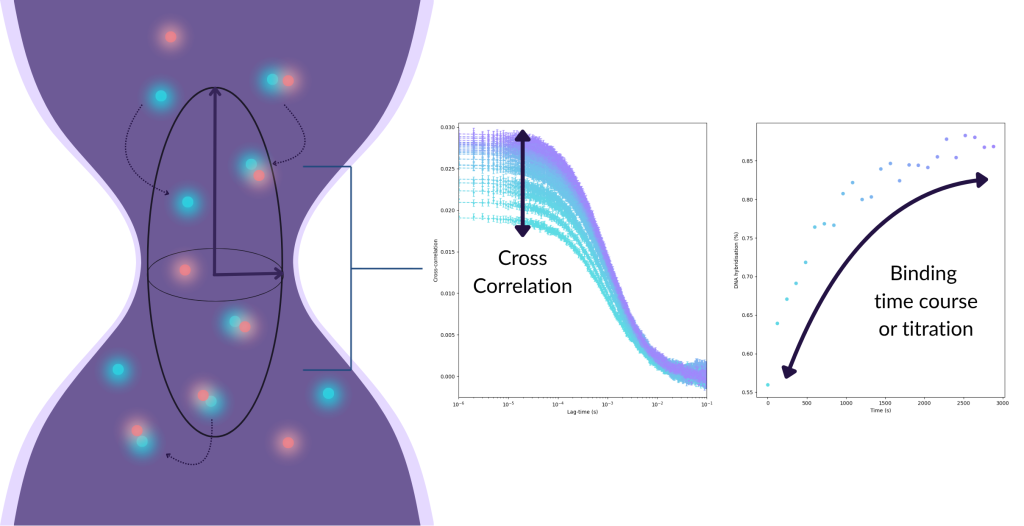
In a single colour FCS experiment, the signal from a single fluorescence intensity trace is analysed using an autocorrelation function that relates the intensity at one point in time to another. While FCCS data is also analysed via time correlation, instead of relating different time points from a single intensity trace with itself, it relates different time points between two different intensity traces. When two freely diffusing molecules with orthogonal fluorescent labels are bound, they will co-diffuse through the excitation volume and produce a greater cross-correlation signal relative to two molecules diffusing independently. The higher the amplitude of the cross-correlation function, the greater the number of interacting molecules.
Cross-correlation allows the extraction of:
- Diffusion times of free vs bound species, including free dye
- Molecular concentration of the interacting complexes
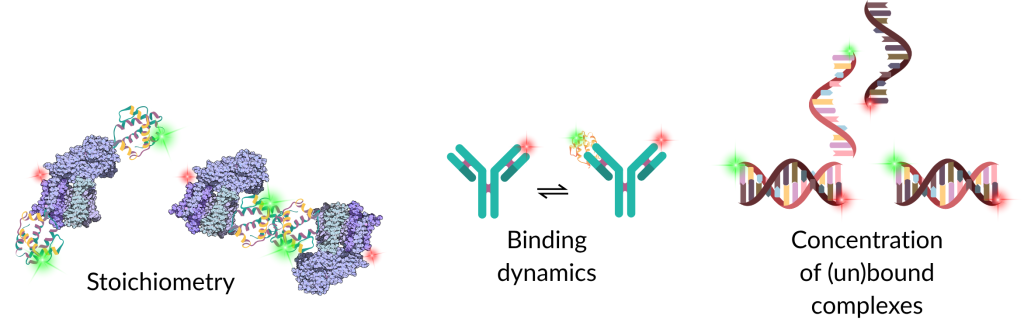
- Stoichiometry of complexes
- Kinetic parameters, such as association/dissociation rates, in systems exhibiting binding dynamics or conformational transitions
What are the benefits of FCCS?
Mass-independent interaction detection
FCCS expands the scope of correlation spectroscopy by enabling the direct detection of molecular interactions. While traditional FCS requires a significant shift in diffusion rate to identify binding, FCCS utilises dual-colour labelling to monitor the target and binder simultaneously. This allows for the detection of:
- Small ligand binding to large receptor proteins
- Protein-protein interactions between molecules of similar size
- Dimerisation events that would be invisible to one-colour diffusion analysis
Direct quantification of binding affinities
FCCS provides a direct readout of the concentration of the bound complex relative to the free species in a single measurement. This enables:
- Precise calculation of dissociation constants (Kd) in complex environments
- Measurement of the degree of binding without needing to physically separate bound and unbound fractions
- Accurate stoichiometry determination by analysing the relative amplitudes of the cross-correlation and autocorrelation curves
High specificity in crowded environments
Because FCCS requires the simultaneous presence of two distinct spectral signatures in the focal volume, it enables the identification and subtraction of background noise and non-specific signals. This makes it ideal for:
- Measuring interactions directly in complex matrices, such as serum or cell lysates
- Distinguishing between autofluorescence and true co-diffusion signals
- Heterogeneous solutions where multiple species are present, but only the interaction between two specific targets is of interest
Low sample consumption
Typically, an FCCS experiment requires samples at low pM to 100 nM concentrations. This is ideal for working with rare, expensive, or difficult-to-express biomolecules.
Broad applicability across research areas
FCCS has been widely applied in:
- Protein–protein and protein–nucleic acid interactions
- Drug binding and screening assays
- Membrane diffusion and receptor dynamics
- Ternary complex formation, such as PROTACs, molecular glues and bispecific antibodies
What are some common applications of FCCS?
FCCS specialises in scenarios where physical association or cleavage needs to be measured with high precision. Given that fluorescent channels can be analysed individually and together, FCCS gains all the benefits of FCS, serving as a versatile analytical tool for probing molecular dynamics, interactions, and stoichiometries with greater accuracy in noisy backgrounds or with biomolecules of similar sizes.
Below are some key applications of FCCS:
1. Protein-Protein and Protein-nucleic acid Interactions
Unlike traditional methods that require the removal of unbound components, FCCS measures interactions directly in solution.
Use cases:
- Determining how strongly two proteins or a protein and a DNA strand interact at nanomolar concentrations, irrespective of their sizes, such as antibody-antigen interactions
- Identifying if a complex is a monomer, dimer, or higher-order oligomer by analysing the brightness and concentration of the cross-correlated signal
- Studying how a third, unlabelled molecule displaces one of the labelled partners in a complex
2. Real-Time Enzyme Kinetics
FCCS is uniquely suited for monitoring enzymatic reactions, such as cleavage assays or ligation and polymerisation.
- Cleavage Assays: As proteases or nucleases cleave the substrate, the cross-correlation amplitude drops in real-time
- Ligation/Polymerisation: Cross-correlation amplitudes will rise as two separately labelled molecular components become a single unit through the action of a ligase or polymerase
- Detecting catalytic activity of enzymatic concentrations at pM concentrations
3. Drug Discovery and Development
In pharmaceutical research, FCCS serves as a high-sensitivity tool for identifying potential drug leads.
- Direct quantification of the formation of ternary complexes, such as molecular glues, PROTACs and bispecific antibodies
- Measuring the binding of small chemical fragments to target proteins in fragment-based discovery
- Quantifying how effectively a candidate drug prevents the formation of a protein-protein complex
- High-throughput screening of candidate libraries with 384-well plate compatibility and rapid data collection
4. Nanotechnology
Researchers use FCCS to characterise the stability and functionalisation of vesicles and synthetic biomolecules.
- Confirming that a drug or dye is attached to a nanoparticle carrier, or release/leakage has occured
- Monitoring the fusion of two differently labelled lipid vesicles
- Quantifying yield and correct assembly of staple strands and scaffolds in DNA origami structures
Given that single-colour data is collected alongside the dual-colour co-diffusion data, the list of applications is extensive – discover many more applications on our FCS technology page.
What does a typical FCCS experiment involve?
A typical FCCS experiment involves:
- Dual fluorescent labelling and sample preparation
Molecules of interest are tagged with two different fluorescent dyes and diluted to picomolar or nanomolar concentrations.
- Dual-laser excitation and synchronised detection
Two lasers of different wavelengths are aligned to overlap in the same confocal volume (~1 femtolitre). As molecules diffuse through this volume, fluorescence intensity fluctuations from both channels are recorded simultaneously. The system detects when bursts in each channel occur at the same time, indicating the molecules are moving as a single unit.
- Cross-correlation-based data analysis
In addition to individual autocorrelation (for each labelled population), the data is processed using a cross-correlation function. This analyses the synchronicity between the two channels to directly determine dissociation constants, binding stoichiometry and co-diffusion for the bound complex.
What are some typical FCCS configurations?
It is common for dyes that fluoresce under green light to be paired with those that are excited under red light. Minimising spectral crossover between dyes is important when detecting co-diffusing species.
Green Fluorophores
TAMRA
Cy3
Cy3B
Atto 532
Atto 550
Alexa Fluor 532
Alexa Fluor 546
Alexa Fluor 555
Red Fluorophores
Cy5
Atto 647
Atto 647N
Alexa Fluor 647
What kinds of experiments does FCCS complement?
FCCS is a powerful technique for measuring molecular interactions in solution and can be paired with other techniques that provide complementary spatial, structural, or biochemical context.
Why it complements FCCS: Provides high-resolution distance information at the nanometre scale.
How it helps: Combines kinetic co-diffusion data from FCCS with structural conformational readouts; smFRET is sensitive to distance (3-10 nm), so it can provide information on how close together the labelled biomolecules are.
Discover everything you need to understand single-molecule FRET and use it to advance your research in our downloadable handbook.
Surface Plasmon Resonance (SPR)
Why it complements FCCS: Ideal for determining on and off rates (kon/koff) of binding with high precision.
How it helps: SPR is a label-free, immobilised method, providing orthogonal binding data while also confirming that the fluorescent tags used in FCCS aren’t interfering with biomolecular binding affinities.
Co-Immunoprecipitation (Co-IP) and Mass Spectrometry
Why it complements FCCS: These ensemble methods can capture one protein and all the biomolecules that are associated with it.
How it helps: FCCS can only measure two fluorescent dyes at a time. Co-IP followed by mass spectrometry can isolate and identify all of the interacting subunits of large complexes, which can then be systematically tested pairwise by FCCS.
Dynamic Light Scattering (DLS)
Why it complements FCCS: DLS measures the average hydrodynamic radius of a sample without requiring fluorescent labelling.
How it helps: Offers an additional, label-free check that biomolecules are interacting with each other.
Cryo-EM and X-Ray Crystallography
Why it complements FCCS: Provides structural information about how interacting biomolecules bind.
How it helps: In addition to the stoichiometric data that FCCS provides, these techniques map the exact atomic interface of biomolecular interactions.
Nuclear Magnetic Resonance (NMR) spectroscopy
Why it complements FCCS: Provides another in-solution technique with atomic-scale resolution.
How it helps: NMR can track conformational changes induced by binding events that have been identified with FCCS.
Biolayer Interferometry (BLI)
Why it complements FCCS: Orthogonal, label-free technique for measuring binding affinities.
How it helps: This surface-based technique is ideal for large-scale screening, from which the top candidates can be investigated using FCCS in a more native, in-solution environment.
Microscale Thermophoresis (MST)
Why it complements FCCS: Measures binding affinities by measuring biomolecular diffusion through a temperature gradient.
How it helps: Highly sensitive to changes in surface charge and hydration, providing a second readout for binding that doesn’t rely on co-diffusion.
Super-Resolution Microscopy (STED, PALM, STORM)
Why it complements FCCS: Unlike FCCS, these techniques are not constrained by the diffraction limit (the focal volume is ~250 nm wide).
How it helps: If FCCS shows that two proteins are co-diffusing, STED or STORM can provide spatial information of where those complexes are localised with 20 nm resolution.
Total Internal Reflection Fluorescence Correlation Spectroscopy (TIRF-FCS)
Why it complements FCCS: Ideal for measuring membrane-bound interactions, especially those with slow diffusion times.
How it helps: TIRF-FCS can build a spatial map of binding affinities across a cell surface, while FCCS observes binding in a 3D volume.
How does FCCS compare to Raster Image Correlation Spectroscopy (RICS)?
While both of these techniques capture the diffusion and interactions of fluorescently labelled biomolecules in solution, their methods and ideal use cases are quite distinct. While FCCS provides high temporal resolution of molecules that diffuse through a fixed point, RICS is a scanning measurement that builds a spatial map of interactions across a wide area. Like FCCS, RICS can follow a single fluorescent tag, or the interaction of two colours – this is known as cross-correlation RICS (ccRICS).
FCCS
- Detects fluctuation on the microsecond scale
- Directly determines the stoichiometry of molecules in a complex
- Highly sensitive to rapid diffusion and binding kinetics
- Provides autocorrelation (from individual fluorescent channels) and cross-correlation
- Low spatial resolution as measurements are taken from a single point
- Measuring fast enzyme kinetics
- DNA hybridisation rates
- Calculating exact Kd values in purified or crude solutions
- Determining optimal therapeutic concentrations for ternary complex formation
RICS
RICS uses a confocal scanning laser that moves across a sample to form an image.
Key features:
- Determines the spatial and temporal context of biomolecular interactions
- Excellent for detecting molecules with slow diffusion rates
- Ideal for working in crowded solutions or membranes
Applications:
- Track dynamics and transport across cellular compartments
- Quantifying the mobility of molecules, distinguishing dynamics between cytosolic and membrane-bound proteins
- Detecting oligomerisation, aggregation and local concentrations
Quick Comparison Table: FCCS vs RICS
| Feature | FCCS | RICS |
|---|---|---|
| Laser movement | Stationary. Fixed at one point. | Scanning. Moves across the sample. |
| Time resolution | Microseconds (μs). Captures very fast events. | Milliseconds (ms). Limited by scan speed. |
| Spatial data | None. Data is from one single spot. | High. Provides a map of the whole image. |
| Molecule speed | Best for fast molecules (small proteins/DNA). | Best for slow molecules (membranes/large complexes). |
| Sample concentration | Must be very low (pM to nM). | Can handle slightly higher concentrations. |
What are the challenges and considerations of FCCS?
Spatial Overlap
Challenge
For FCCS to work, both lasers must overlap perfectly in 3D space. Even a slight shift between the two lasers will cause the cross-correlation amplitude to drop significantly, even if 100% molecules are bound.
Consideration
The EI-FLEX system comes with aligned lasers – daily calibrations using dyes are recommended to ensure that the system is working as expected.
Spectral Cross-Talk and Bleed-Through
Challenge
Bleed-through occurs when photons emitted from one fluorophore are detected in the channel for the other fluorophore. This results in a false positive signal in the second channel as the second fluorophore is not emitting the detected photons. Cross-talk refers to when the laser for one fluorophore directly excites the second fluorophore, potentially producing a positive signal even when co-diffusion is not occurring.
Consideration
Use Pulsed Interleaved Excitation (PIE) or Alternating Laser Excitation (ALEX). These techniques pulse the lasers nanoseconds or microseconds apart, respectively, identifying photons that don’t match the timing of the correct laser.
Labelling Efficiency
Challenge
FCCS only detects complexes when both labels are emitting photons. If only half of each population is correctly labelled, only 25% of complexes will cross-correlate – the rest will either contain one labelled component, or both will be dark.
Consideration
Labelling efficiencies should be calculated to determine the maximum expected cross-correlation amplitude based on the labelled ratios.
Dynamic Range of Concentration
Challenge
If the sample concentration is too low, such as in the low picomolar range, there won’t be enough photons detected to build a statistically significant curve within a reasonable timeframe. If it’s too high (above ~200 nM), the fluctuations from individual molecules diffusing in and out of the confocal volume become undetectable due to the high background, and the correlation disappears.
Consideration
The ideal concentration range for FCCS is around 1 nM – 100 nM. Picomolar concentrations are feasible, although acquisition time will be greatly extended. Performing a concentration titration can help to define the optimal working range.
Photobleaching and photostability
Challenge
The fluorescent dyes used to label biomolecules for FCCS are liable to bleach when exposed to high or prolonged light. If a molecule bleaches while it is inside the focal volume, it will be recorded as having diffused out, artificially shortening the measured diffusion time. Fluorophores can also enter non-emissive dark states (such as a triplet state), which introduce photophysical artefacts into FCCS data.
Consideration
It is recommended that photostable dyes should be used to mitigate photodamage as much as possible. There are also correction protocols and software to help account for photophysical artefacts. It is good practice to use the minimum necessary laser power to generate a signal.
Many of the considerations for FCS are also applicable to FCCS. To read more on this topic, see our FCS page.
Who Can Use Fluorescence Cross-Correlation Spectroscopy (FCCS)?
FCCS is the dual-channel evolution of FCS, ideal for pinpointing exactly when, where, and how strongly two distinct species associate in real-time. It has a wide range of applications, spanning biophysical assays investigating the structure and composition of multiunit complexes, to drug discovery and development pipelines, such as the characterisation of ternary complexes or small-molecule ligands.
The EI-FLEX system has dramatically lowered the barrier to entry for FCCS, broadening its accessibility across specialisms and sectors while also providing highly complementary smFRET and FCS all on the same platform.
1. Biophysicists
Application Focus
Biophysicists use FCCS to move from diffusion-based estimates to absolute co-diffusion analysis, providing mass-independent measures of molecular binding.
Typical Objectives
- Quantifying binding affinities (Kd) and complex stoichiometry
- Distinguishing specific binding from random spatial overlap in crowded media
- Analysing oligomerisation states and molecular brightness to define protein aggregation pathways
2. Structural Biologists
Application Focus
FCCS bridges the gap between static structural snapshots (such as those from Cryo-EM and X-ray crystallography) and dynamic behaviour in solution.
Typical Objectives
- Verifying the assembly/disassembly of heteromeric complexes
- Determining if structural subunits remain associated during fast conformational transitions
- Quantifying bound vs. unbound ratios to refine structural models
3. Biochemists and Molecular Biologists
Application Focus
FCCS supports the study of biomolecular binding and functional studies at physiological concentrations without the need for physical separation.
Typical Objectives
- Monitoring DNA hybridisation or the scanning/binding kinetics of systems like CRISPR-Cas9
- Characterising protein-protein interactions in crude cell lysates or complex buffers
- Investigating allosteric regulation, where the binding of one partner influences the recruitment of a second
4. Nanotechnologists and Bioengineers
Application Focus
FCCS is used to verify the functional integrity of engineered delivery systems and the successful loading of multi-functional nanoparticles.
Typical Objectives
- Confirming the stable attachment of drugs or the targeting of ligands to a nanoparticle carrier
- Monitoring vesicle fusion or the assembly of DNA origami components in real time
- Evaluating the co-transport of multiple therapeutic agents through synthetic or biological pores
5. Pharmaceutical and Drug Discovery Scientists
Application Focus
FCCS is a highly sensitive tool for hit validation and ternary complex analysis, providing quantitative confirmation of binding or dissociation.
Typical Objectives
- Screening for small-molecule inhibitors that disrupt or stabilise a specific protein-protein interaction
- Measuring target engagement in complex environments (e.g., serum or lysates) using dual-colour specificity
- Directly quantifying the formation of ternary complexes such as PROTACs, molecular glues, or bispecific antibodies
6. Biotechnologists and Assay Developers
Application Focus
FCCS is the ideal technique for validating cleavage-based assays and characterising the performance of dual-labelled molecular probes.
Typical Objectives
- Monitoring protease or nuclease activity by watching the disappearance of cross-correlation as a substrate is cleaved
- Performing quality control on dual-labelled sensors to ensure both fluorophores are active
- Validating the stability and cross-talk profile of new dye pairs for advanced imaging applications
7. Academic Labs and Core Facilities
Application Focus
As a highly collaborative tool, FCCS serves as a centrepiece for interdisciplinary projects requiring the highest level of detail regarding molecular associations.
Typical Objectives
- Supporting cross-disciplinary projects, such as those between biophysics and molecular biology
- Providing robust access to single-molecule techniques that are accessible regardless of experience level
- Enabling multi-user access to sensitive, real-time quantification of molecular interactions
Considerations for new users
FCCS introduces specific technical challenges, most notably the requirement for perfect spatial overlap of two lasers and the management of spectral crosstalk. However, the integration of user-friendly software and automated calibration on the EI-FLEX system has significantly lowered the barrier to entry.
With proper fluorophore selection and support from the team at Exciting Instruments, FCCS can be implemented in protocols with ease, providing a level of interaction data that is simply unattainable by single-colour or ensemble, indirect methods.
What does the future of FCCS hold?
FCCS is transitioning from a specialised biophysics tool into a more automated, integrated, and high-throughput technology. The future of FCCS is defined by its fusion with artificial intelligence, quantum sensors, and clinical diagnostics.
AI-Driven Signal Analytics
Historically, the biggest bottleneck for FCCS has been the complex data fitting and the noise generated from biological samples.
- Automated Parameter Extraction: Future systems are integrating machine learning to automatically identify and filter photophysical artefacts and fit correlation curves without human bias
Quantum-Enhanced FCCS
A major leap in sensitivity is coming from the world of quantum sensing.
- Nanodiamond Sensors: Researchers are beginning to use nitrogen-vacancy (NV) centres in nanodiamonds as the labels for FCCS. Unlike traditional dyes, these do not photobleach, allowing for long measurement times to capture extremely rare binding events
- Quantum Dot Multiplexing: Next-generation quantum dots with pure colours are reducing the spectral crosstalk that has historically plagued FCCS, enabling three- or even four-colour cross-correlation
Integrated Microfluidics and Lab-on-a-Chip
FCCS is moving out of the lab and onto portable chips. The development of optofluidic chips combines microfluidics with optical sensing of biomolecules.
- Point-of-Care Diagnostics: Future diagnostic devices may use microfluidic FCCS to detect viral loads or biomarkers in blood samples. By looking for the co-diffusion of a patient’s protein with a diagnostic probe, these chips can provide a result in minutes
- Single-Cell Proteomics: Integrating FCCS with microfluidics would enable the analysis of the contents of a single cell immediately after it is lysed on-chip, preserving the native state of protein complexes that are usually lost in bulk lysates
Conclusion
FCCS delivers unparalleled single-molecule clarity into the mechanisms of biomolecular binding. By combining next-generation labelling, AI-driven analytics, and optofluidic integration, we are moving beyond specialised biophysics into a new era of precision that is accessible to all. This shift promises to transform the life sciences, turning complex molecular dynamics into actionable insights for research, drug discovery and global diagnostics.

Dr Timothy Craggs
Founder & CEO
“FCS and FCCS provide highly quantitative, scalable (high-throughput) approaches to answer key biological and biomedical questions. We are excited to be developing a range of benchtop instruments, assays and benchmarks, for basic research, fluorophore characterisation, drug discovery and early diagnostics.”