Fluorescence Correlation Spectroscopy (FCS) – Principles, Analysis, and Applications
A guide to fluorescence correlation spectroscopy
Table of Contents
Test goes here
What is Fluorescence Correlation Spectroscopy (FCS)?
Fluorescence Correlation Spectroscopy is a powerful single-molecule technique that enables quantitative analysis of molecular dynamics based on fluctuations in fluorescence intensity. By monitoring these fluctuations within a defined observation volume, FCS provides high-resolution insights into key biophysical parameters, including diffusion coefficients, molecular concentrations, molecular brightness, hydrodynamic radii, and kinetic rates of binding interactions.
Unlike ensemble-averaging techniques that report on the bulk behaviour of a population, FCS operates with single-molecule sensitivity, capturing real-time events as individual fluorescent molecules diffuse into and out of a sub-femtoliter detection volume. This makes FCS especially suited for detecting rare molecular interactions, low-abundance species, and fast dynamic equilibria in dilute samples – typically within the nanomolar to picomolar concentration range.
How does Fluorescence Correlation Spectroscopy work?
FCS measurements are performed by tightly focusing a laser beam through a high numerical aperture objective to generate a diffraction-limited confocal volume – generally on the order of 0.1–1 femtoliter. Fluorescently labelled molecules diffuse stochastically through this volume, and their transient presence results in detectable bursts of fluorescence.
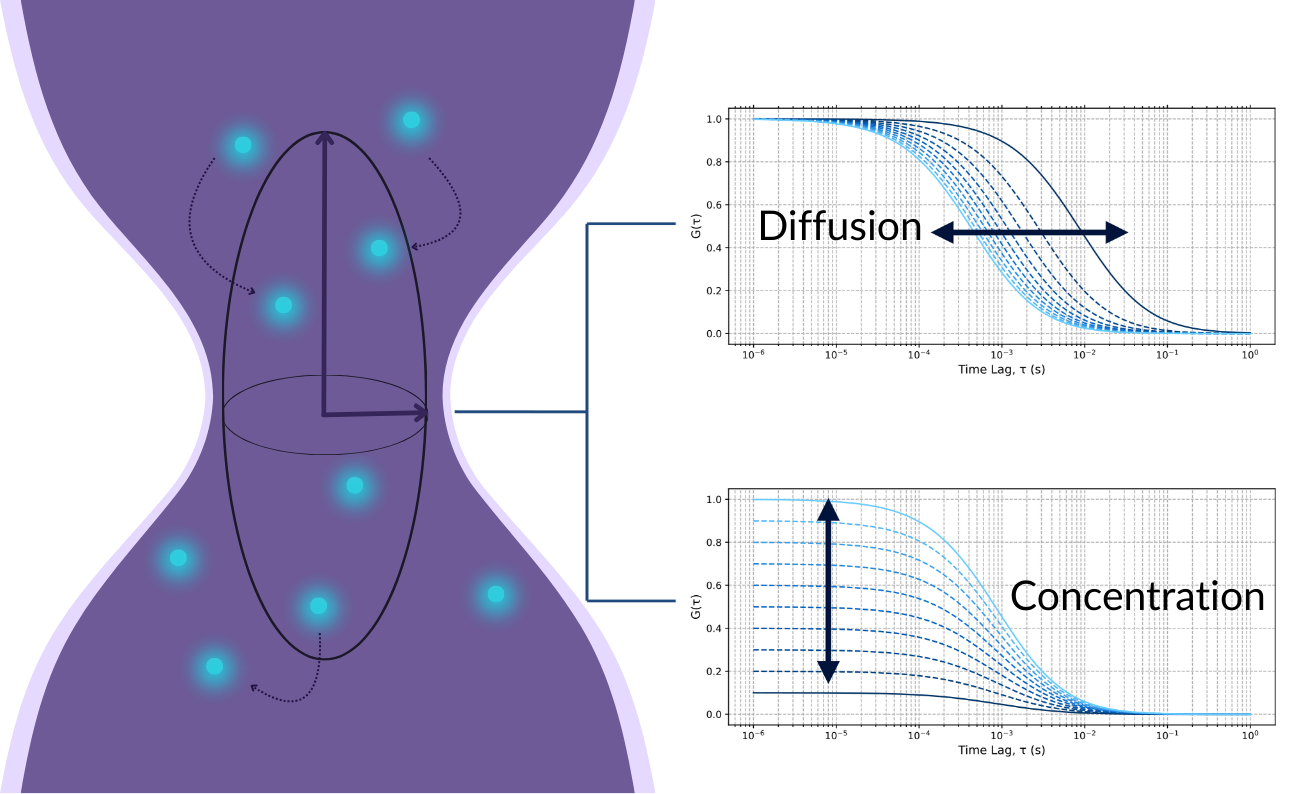
The fluorescence signal is recorded with high temporal resolution, often in the microsecond range, and analysed using autocorrelation functions (ACF). The ACF mathematically describes the similarity of the fluorescence signal with itself over varying time lags, allowing the extraction of:
- Diffusion times, from which diffusion coefficients and molecular sizes are inferred
- Average number of fluorescent molecules (N), used to determine molecular concentration
- Brightness of fluorophores and extent of bioconjugation
- Kinetic parameters, such as association/dissociation rates, in systems exhibiting binding dynamics or conformational transitions
- Equilibrium constants, such as Kd values

By fitting the autocorrelation data to appropriate physical models (e.g. free diffusion, anomalous diffusion, reaction-diffusion), researchers can extract robust quantitative parameters that reflect the biophysical behaviour of the system under study.
What are the benefits of FCS?
1. Single-Molecule Sensitivity
FCS detects the fluorescence signal of individual molecules as they traverse the confocal volume, enabling studies at extremely low concentrations (picomolar to nanomolar). This is crucial for investigating systems where traditional ensemble techniques fail due to insufficient signal or sample scarcity.
2. Real-Time Kinetic Measurements
Capture dynamic molecular events in real-time, including:
- Diffusion of molecules
- Fast equilibrium binding interactions
- Intramolecular conformational changes
3. Quantitative and Model-Based Analysis
FCS yields precise, model-derived data such as:
- Diffusion coefficients (D)
- Molecular concentration (C)
- Molecular brightness
- Reaction kinetics ( kon/koff) in ligand-receptor systems
- Equilibrium constants such as Kd values
4. Low Sample Consumption
Typically, an FCS experiment requires samples at low pM to 100 nM concentrations. This is ideal for working with rare, expensive, or difficult-to-express biomolecules.
5. Broad Applicability Across Research Areas
FCS has been widely applied in:
- Protein–protein and protein–nucleic acid interactions
- Antibody-antigen interactions
- Drug binding and screening assays
- Membrane diffusion and receptor dynamics
- Aggregation of intrinsically disordered proteins
What are some common applications of FCS?
Fluorescence Correlation Spectroscopy has evolved into a cornerstone technique in molecular and cellular biophysics, chemical biology, and quantitative imaging. Originally developed to measure diffusion coefficients of molecules in solution, FCS now serves as a versatile analytical tool for probing molecular dynamics, interactions, and stoichiometries – across environments ranging from dilute buffer to complex matrices such as serum or cell lysates.
By detecting real-time fluorescence fluctuations from individual molecules diffusing through a defined observation volume, FCS provides quantitative, high-resolution data on concentration, diffusion speed, and reaction kinetics, with applications spanning fundamental research and drug discovery.
Below are key domains where FCS has a transformative impact:
1. Protein Diffusion and Oligomerisation
Application
FCS accurately quantifies protein diffusion through the confocal volume. Changes in diffusion time or hydrodynamic radius reveal oligomerisation states, complex formation, or aggregation behaviour.
Use Cases
- Differentiating monomers, dimers, and higher-order aggregates
- Detecting self-association kinetics and transient oligomerisation
2. Enzyme Binding Kinetics and Turnover
Application
By monitoring diffusion shifts or changes in brightness, FCS provides real-time data on enzyme-substrate interactions, binding affinities, and conformational dynamics of catalytically active complexes.
Use Cases
- Determining association (kon) and dissociation (koff) rates
- Quantifying the formation of enzyme-substrate complexes
- Evaluating inhibitor binding or competitive displacement mechanisms
3. Nucleic Acid Hybridisation and Folding
Application
FCS enables precise measurement of DNA/RNA hybridisation, secondary structure formation, and ligand binding by detecting diffusion changes and fluorescence fluctuation patterns.
Use Cases
- Tracking aptamer–ligand interactions under physiological conditions
- Monitoring guide RNA–target DNA hybridisation (e.g., CRISPR systems)
- Detecting dynamic changes of DNA hairpins, pseudoknots, or structured RNA motifs
4. Membrane and Lipid Dynamics
Application
Using FCS, researchers can probe lipid diffusion, membrane protein mobility, and lipid–protein interactions within native-like environments such as nanodiscs.
Use Cases
- Quantifying lateral diffusion of membrane-bound species
- Investigating lipid raft formation or domain segregation
- Measuring partitioning of small molecules or drugs into lipid bilayers
5. Ligand Binding and Small Molecule Screening
Application
FCS detects binding events via shifts in diffusion times or fluorescence brightness, providing a sensitive, non-invasive platform for drug screening and target engagement assays.
Use Cases
- Performing high-throughput screening of candidate libraries in 96 or 384-well plate formats
- Assessing affinity during fragment-based drug discovery
- Quantifying ligand binding in complex matrices, such as serum or cell lysates
6. Phase Separation and Condensate Formation
Application
FCS reveals dynamic properties within liquid-liquid phase-separated (LLPS) condensates, including partitioning, local viscosity, and molecular exchange, which are critical in biomolecular condensate research.
Use Cases
- Quantifying partitioning of proteins/RNAs into condensates
- Measuring diffusion and crowding inside phase-separated droplets
- Studying client molecule recruitment into stress granules, nucleoli, or P bodies
7. Molecular Interactions via Fluorescence Cross-Correlation Spectroscopy (FCCS)
FCCS, an extension of FCS using dual-colour detection, allows direct measurement of molecular co-diffusion and interaction in solution.
Use Cases
- Confirming heterodimer or multi-protein complex formation
- Characterising ternary complex formation, such as molecular glues, PROTACs or bispecific antibodies
- Detecting transient co-localisation or dynamic exchange of subunits
8. Population Heterogeneity and Dynamic Partitioning
Application
By fitting complex autocorrelation models, FCS resolves distinct molecular populations with varying diffusion behaviours, binding states, or conformational transitions.
Use Cases
- Separating free vs. bound species in equilibrium systems
- Profiling receptor activation states on heterogeneous membranes
- Identifying subpopulations of molecules undergoing conformational exchange
9. Method Development and Instrument Calibration
Application
FCS serves as a gold standard for validating optical performance, benchmarking fluorophores, and optimising detection schemes for new analytical methods.
Use Cases
- Calibrating diffusion standards for fitting accuracy
- Evaluating fluorophore brightness, photostability, and blinking behaviour
- Identifying aggregation of conjugated fluorophores
10. Quantifying Oligomeric States Using Brightness Analysis
Application
Brightness analysis – often integrated with FCS – provides a model-free approach to quantify oligomeric states of biomolecules by analysing the average photon count per particle.
Use Cases
- Determining protein stoichiometry under native conditions, without separation
- Differentiating monomers, dimers, and higher-order multimers
Monitoring dynamic oligomerisation equilibria in response to stimuli (e.g., pH, ligands) - Benchmarking fluorophore brightness consistency to validate quantification accuracy
What does a typical FCS experiment involve?
A typical experiment involves:
- Fluorescent labelling and sample preparation
Molecules of interest are tagged with a single fluorescent dye and diluted, typically picomolar to nanomolar concentrations. - Laser excitation and photon detection
A laser is focused into a small, confocal volume (~1 femtoliter) where fluorescently-labelled molecules are excited. As molecules diffuse in and out of this volume, fluorescence intensity fluctuates and is recorded at nano- to micro-second resolution. - Autocorrelation-based data analysis
Time-resolved intensity fluctuations are analysed using autocorrelation functions to extract physical parameters like diffusion coefficients, molecular concentrations, and kinetic rates of binding or conformational change.
What are leading researchers saying about FCS?
“FCS lets us see not just if molecules interact – but how fast, how often, and under what conditions. It’s the kinetics that matter.”
Dr. A. Kumar
Cell Biophysics Lab, EMBL
What are some typical FCS configurations?
Fluorophores
ATTO 425/465*
Alexa Fluor 430
ATTO 520*/532
Alexa Fluor 514
ATTO 633/647N *
Alexa Fluor 647
*recommended fluorophores for FCS based on brightness and photostability
Excitation Laser(s)
450 nm
450 nm
520 nm
520 nm
638 nm
638 nm
Note: In contrast to smFRET, FCS typically requires only one fluorophore per molecule, although FCCS (Fluorescence Cross-Correlation Spectroscopy) expands this to two-colour systems for studying interactions.
What kinds of experiments complement FCS?
FCS becomes even more powerful when paired with complementary methods that enhance spatial resolution, mechanical control, or structural interpretation. These techniques offer orthogonal perspectives that expand the insights FCS can provide.
Single-Molecule FRET (smFRET)
Why it complements FCS: Provides high-resolution distance information at the nanometer scale.
How it helps: Combines kinetic diffusion data from FCS with structural conformational readouts from FRET.
Fluorescence Recovery After Photobleaching (FRAP)
Why it complements FCS: Measures bulk diffusion and recovery dynamics over longer timescales.
How it helps: Validates or contextualises FCS-derived diffusion coefficients in membranes or viscous environments.
Fluorescence Cross-Correlation Spectroscopy (FCCS)
Why it complements FCS: Measures co-diffusion of two differently labelled species in real-time.
How it helps: Confirms molecular interactions, binding stoichiometry, and complex formation.
Fluorescence Lifetime Imaging Microscopy (FLIM)
Why it complements FCS: Adds another dimension to fluorescence analysis: lifetime, independent of intensity.
How it helps: Filters out background noise, distinguishes between multiple species with overlapping spectra, and accounts for local environmental changes.
Super-Resolution Microscopy (STED, PALM, STORM)
Why it complements FCS: Probes molecular dynamics at scales far below the diffraction limit (down to ~20 nm).
How it helps: Maps the spatial organisation of diffusing molecules or identifies domains that modulate mobility.
Total Internal Reflection Fluorescence (TIRF) Microscopy
Why it complements FCS: Selectively excites fluorophores near a surface.
How it helps: Ideal for surface FCS to probe membrane protein dynamics, 2D diffusion, and processive molecules like kinesins.
Dynamic Light Scattering (DLS)
Why it complements FCS: Measures ensemble hydrodynamic sizes.
How it helps: Provides reference size distributions for validating diffusion-based sizing in FCS in a label-free manner.
Single-Particle Tracking (SPT)
Why it complements FCS: Tracks individual molecules over time.
How it helps: Dissects heterogeneity and trajectories that FCS averages out.
Microscale Thermophoresis (MST)
Why it complements FCS: Measures binding affinities through thermophoretic motion.
How it helps: Supports FCS binding data with orthogonal readouts of interaction strength.
Patch-Clamp Electrophysiology
Why it complements FCS: Measures electrical activity of ion channels and transporters.
How it helps: Links transport events to mobility and concentration changes captured by FCS.
| Method | Single-molecule sensitivity | In-solution | Absolute concentration | Stoichiometry | Binding kinetics | Binding affinity | Dye brightness | Hydrodynamic radius | Label-free | Thermodynamics |
|---|
FCS is a uniquely powerful technique that delivers real-time, quantitative insights into molecular motion, concentration, and binding dynamics with single-molecule sensitivity. With minimal labelling requirements and a range of complementary approaches, FCS is central to workflows across:
- Kinetic drug discovery
- Molecular crowding and compartmentalisation studies
- Diffusion and transport analyses in membranes and condensates
Its low sample requirements and broad applicability make it a flexible, high-impact technique in both basic research and translational science.
How does confocal FCS compare to imaging-based or TIRF-FCS?
All FCS approaches share the same foundational principle: analysing fluorescence intensity fluctuations caused by the movement of individual molecules in and out of a defined observation volume. These fluctuations are used to derive kinetic parameters such as diffusion coefficients, molecular concentrations, and binding dynamics. The distinction lies in how the fluorescence is excited, collected, and analysed, which is distilled into two primary implementations:
Confocal FCS (Solution-Based, Point Detection)
Confocal FCS is the traditional and most widely used implementation, providing a robust, highly repeatable technique. It involves exciting and detecting fluorescence from a single diffraction-limited spot within a small volume in solution.
Key features:
- Molecules are freely diffusing in solution (not immobilised)
- Uses single-point laser excitation and avalanche photodiode detection
- Extremely high temporal resolution (microsecond timescale)
- High sensitivity to fast diffusion and rapid binding kinetics
- Produces autocorrelation curves from fluorescence time traces
- Typically lower spatial resolution; single-point measurements only
Applications:
- Measuring protein diffusion in dilute solution
- Analysing binding kinetics (kon/koff) and molecular brightness
- Quantifying hydrodynamic radii and oligomerisation states
- High-throughput screening with flow systems or microfluidics
TIRF-FCS / Imaging-Based FCS (Surface-Based, Spatial Mapping)
TIRF-FCS or camera-based imaging FCS extends FCS into the spatial domain by using wide-field excitation (e.g., TIRF or epi-illumination) and EMCCD/sCMOS cameras to detect fluctuations across many pixels simultaneously.
Key features:
- Molecules are either diffusing in a 2D plane (e.g., membrane surface) or partially immobilised
- Excitation is limited to a shallow region (typically 100–200 nm for TIRF)
- Enables spatial mapping of diffusion and mobility heterogeneity
- Moderate temporal resolution (millisecond timescales typical for camera acquisition)
- Captures data from hundreds of locations in parallel
- Produces spatially resolved correlation maps or diffusion heatmaps
Applications:
- Studying membrane protein diffusion in lipid bilayers or cells
- Mapping viscosity or crowding differences across cell surfaces
- Observing lateral mobility and compartmentalisation in membranes
- Visualising heterogeneity in molecular behaviour across fields of view
Quick Comparison Table: Confocal FCS vs. TIRF-FCS
| Feature | Confocal FCS | TIRF-FCS / Imaging FCS |
|---|---|---|
| Molecule state | Freely diffusing in 3D solution | Diffusing in 2D plane or near-surface volume |
| Spatial resolution | Single-point, low spatial resolution | High (pixel-resolved spatial mapping) |
| Temporal resolution | Very high (µs-ms) | Moderate (ms-s) |
| Parallel measurements | Limited (one point at a time) | High (hundreds of pixels in parallel) |
| Setup | Confocal or multiphoton laser scanning | TIRF, wide-field, or spinning disk setups |
| Output | Autocorrelation curves, diffusion coefficients | Spatial diffusion maps, pixel-wise correlation data |
| Use cases | Solution kinetics, concentration analysis | Surface diffusion, membrane heterogeneity |
Both confocal FCS and imaging-based FCS rely on fluctuation analysis, but they serve complementary needs:
- Confocal FCS is ideal for high-sensitivity, time-resolved studies of molecules in solution or inside cells at a single point
- TIRF-FCS and imaging FCS enable parallel spatial analyses, revealing heterogeneous dynamics in membranes or structured environments
Researchers often choose based on their experimental question: precise kinetics (confocal) vs. spatially mapped behaviour (TIRF/imaging).
What are the challenges and considerations of FCS?
While FCS offers powerful capabilities for probing molecular diffusion, interactions, and concentrations at the single-molecule level, it also presents unique experimental and analytical considerations:
Photobleaching and Photophysics
Challenge
Fluorophores are susceptible to photobleaching and may also enter non-emissive dark states (e.g., triplet states or blinking), which introduces artefacts into the intensity fluctuations critical for FCS. These effects can distort autocorrelation curves, reduce signal stability, and limit acquisition time.
Consideration
To mitigate these effects, select photostable dyes with low triplet-state populations and use minimal excitation intensity to reduce photodamage. Incorporating triplet-state correction terms or blinking models in the analysis software improves data accuracy. Ensuring sufficient photon count rates without overexcitation is key for stable, interpretable signals. FCS has a small excitation volume and uses short exposure times, which mitigate the effects of photobleaching relative to other fluorescence techniques.
Labelling Strategy and Brightness
Challenge
Reliable FCS depends on uniform brightness and consistent labelling of target molecules. Dim fluorophores or heterogeneously labelled populations reduce signal-to-noise ratios and can result in misleading diffusion parameters. Over-labelling may also lead to aggregation or altered diffusion behaviour. Therefore, choosing the right dyes and labelling strategy is key.
Consideration
Choose high-quantum-yield fluorophores with proven stability in the relevant environment. Validate fluorophore brightness using brightness histograms or photon count distributions before full-scale analysis. Optimise your protocols to avoid over- or under-labelling, and test for potential aggregation effects, especially in protein complexes or large assemblies.
Concentration Range
Challenge
FCS requires extremely dilute samples, typically in the picomolar to low nanomolar range. At higher concentrations, while overall count rates and fluctuation frequencies increase, the fluctuation amplitude and correlation amplitude decrease, reducing the signal-to-noise ratio.
Consideration
Perform a concentration titration to identify the optimal working range. Use photon counting histograms (PCH) or cumulant analysis to confirm that the system is operating under true single-molecule conditions. Avoid background fluorescence and verify system linearity at low concentrations.
Autocorrelation Analysis
Challenge
Accurately extracting diffusion coefficients, binding kinetics, or interaction rates from autocorrelation curves requires correct model selection, proper baseline subtraction, and noise minimisation. Inappropriate fitting models or unrecognised noise sources can yield misleading parameters.
Consideration
Utilise advanced fitting tools that support multi-component diffusion, triplet-state corrections, and anomalous diffusion models. Cross-validate fits using goodness-of-fit metrics and apply global analysis when comparing multiple datasets. Benchmark your models using known standards for confidence in extracted parameters.
System Calibration
Challenge
The accuracy of FCS measurements depends on a precisely defined detection volume, which varies with alignment, objective properties, and refractive index mismatches. Without proper calibration, diffusion coefficients and concentration values may be unreliable.
Consideration
Routinely calibrate the system using standard dyes (e.g., Rhodamine 6G in water) with well-known diffusion constants. Confirm the confocal volume size and adjust parameters accordingly. Recalibrate after realignment, objective swaps, or significant environmental changes (e.g., temperature or refractive index shifts).
Handling Anomalous Diffusion and Crowded Environments
Challenge
In many biologically relevant systems, diffusion does not follow ideal Brownian motion. Instead, molecules may exhibit subdiffusion, transient confinement, or hop diffusion due to crowding, molecular obstacles, or compartmentalisation. These non-ideal behaviours complicate the interpretation of standard autocorrelation functions and can lead to misestimation of diffusion coefficients or binding kinetics if not accounted for.
Consideration
To address this, researchers should apply advanced diffusion models (e.g., anomalous diffusion, two-component fits, or continuous time random walks) when analysing FCS data from crowded environments. Including control measurements in dilute systems helps establish baselines, while model selection criteria (like the Akaike Information Criterion) aid in identifying the best-fitting dynamics. Spatially resolved techniques such as TIRF-FCS or STED-FCS can also help reveal heterogeneity in local environments, offering deeper insight into how confinement or crowding modulates molecular behaviour.
Using Global Fitting for Robust Kinetic Interpretation
Challenge
Fitting FCS autocorrelation curves for kinetic parameters – such as binding rates, residence times, or diffusion coefficients – can be statistically underdetermined when performed on individual datasets. Single-curve fits are often sensitive to noise, fluorophore heterogeneity, or local fluctuations, leading to variable or inconsistent parameter estimates across replicates.
Consideration
Global fitting approaches allow the simultaneous fitting of multiple autocorrelation datasets under shared parameters (e.g. global kon/koff, local concentrations), enhancing statistical confidence and parameter robustness. This strategy is especially valuable when comparing conditions (e.g. drug-treated vs. control), replicates, or titration series. Use fitting software that supports linked parameter constraints, batch fitting, and model selection tools (e.g. Akaike Information Criterion or Bayesian Information Criterion) to ensure biologically meaningful interpretations with reduced overfitting risk.
Who Can Use Fluorescence Correlation Spectroscopy (FCS)?
Fluorescence Correlation Spectroscopy (FCS) is a versatile, cross-disciplinary technique suited for researchers who require quantitative, real-time insights into molecular behaviour at nanomolar concentrations and sub-micrometre spatial scales. With applications ranging from fundamental biophysics to translational drug discovery, FCS empowers scientists to probe diffusion, interactions, and conformational changes with single-molecule sensitivity.
While optimal use benefits from a basic understanding of fluorescence principles and correlation analysis, the modern instrumentation and analysis software provided by the EI-FLEX and EI-FLEX Pro have significantly lowered the technical barrier, making FCS more accessible across diverse fields.
1. Biophysicists
Application Focus
Biophysicists use FCS to dissect the physical principles governing molecular dynamics, including diffusion behaviour, intermolecular forces, and structural flexibility in proteins, nucleic acids, and disordered biomolecules.
Typical Objectives
- Quantifying diffusion coefficients under varying crowding or viscosity conditions
- Measuring binding kinetics (kon/koff) in complex interaction networks
- Detecting conformational transitions in intrinsically disordered proteins and multi-domain proteins
2. Structural Biologists
Application Focus
FCS complements high-resolution structural methods like cryo-EM, X-ray crystallography, and NMR, offering a solution-phase perspective on biomolecular behaviour in native or near-native environments.
Typical Objectives
- Observing real-time structural rearrangements in macromolecular complexes
- Monitoring assembly and disassembly of oligomeric states in solution
- Studying dynamics of structural domains under physiological conditions
3. Biochemists and Molecular Biologists
Application Focus
FCS allows these researchers to examine functional biomolecular interactions at the molecular level, under conditions that preserve biological relevance.
Typical Objectives
- Characterising protein–protein and protein–nucleic acid interactions
- Investigating enzyme–substrate binding and catalytic turnover rates
- Measuring cofactor binding or allosteric modulation in real time
4. Nanotechnologists and Bioengineers
Application Focus
FCS is increasingly applied in nanotechnology and bioengineering to analyse engineered particles, biosensors, and synthetic biomolecular constructs.
Typical Objectives
- Measuring hydrodynamic radius and diffusion of nanoparticles or drug carriers
- Assessing surface functionalisation or ligand loading on nanomaterials
- Evaluating membrane permeability of engineered vesicles or constructs
6. Pharmaceutical and Drug Discovery Scientists
Application Focus
FCS, and its dual-colour variant FCCS, provide a powerful toolkit for early-stage screening, hit validation, and target engagement assays, all with minimal sample volume.
Typical Objectives
- Screening small-molecule binders based on diffusion shifts or ternary complex formation
- Measuring target occupancy or binding kinetics in complex lysates
- Studying drug-induced protein complex formation and aggregation effects
7. Biotechnologists and Assay Developers
Application Focus
FCS is an ideal technique for characterising new dyes, ensuring dyes remain stable and functional in intended biological conditions.
Typical Objectives
- Quantifying brightness and dye behaviour upon bioconjugation
- Detecting unwanted aggregation and performing QC to ensure batch consistency
- Confirming dyes perform as expected within complex physiological environments
8. Academic Labs and Core Facilities
Application Focus
In academia, FCS is a standard tool in interdisciplinary labs spanning physics, chemistry, biology, and engineering. It supports both basic research and method development.
Typical Objectives
- Enabling researchers to explore molecular dynamics in novel systems
- Providing shared instrument access, user training, and technical support
- Supporting collaborative projects across disciplines (e.g., biophysics + synthetic biology)
FCS is increasingly integrated into workflows wherever precise, real-time quantification of molecular behaviour is required. Whether the goal is understanding molecular diffusion in a crowded cytoplasm, quantifying binding events in drug assays, or tracking engineered nanostructures, FCS offers unmatched resolution and sensitivity.
Considerations for New Users
While technical factors like fluorophore selection, photophysical properties, and data-fitting models are important, advances in hardware and user-friendly analysis platforms have greatly simplified the learning curve. With appropriate training and support, FCS can be implemented by researchers across scientific disciplines, from early-career graduate students to industry professionals.
What does the future of FCS hold?
The future of FCS is bright – it is evolving from a specialist tool into a mainstream method that can be integrated across life sciences, materials research, and drug development.
Artificial Intelligence and Advanced Analysis
Machine learning and AI-based algorithms are being applied to autocorrelation fitting, anomaly detection, and multi-component systems.
- Future impact: Faster and more accurate interpretation of complex fluctuation data, enabling reliable real-time diagnostics and deeper kinetic modelling.
Enhanced Fluorophores
The next generation of photostable, bright fluorophores are expanding what FCS can detect.
- Future impact: Detection of subtle interaction shifts, dynamic signalling changes, or conformational states with improved signal-to-noise and reduced background.
Biosensors for Diagnostics
FCS-based biosensors have the advantage of working directly in complex biofluids at picomolar concentrations.
- Future impact: Highly sensitive biosensors that can detect early clinically-relevant events directly in serum and other fluids, from the first stages of protein aggregation to real-time pharmacokinetic monitoring.
Integration with Complementary Techniques
FCS is increasingly being paired with other biophysical and imaging methods – such as super-resolution microscopy, smFRET, FLIM, and mass spectrometry – to achieve multi-dimensional insight into molecular behaviour.
- Future impact: Unified views of spatial organisation, conformational dynamics, and binding kinetics in a single experimental framework.
Real-Time Therapeutic Monitoring and Target Engagement
With enhanced portability and sensitivity, FCS is poised to move into clinical and translational applications, including real-time drug response monitoring and patient-specific target analysis.
- Future impact: Applications in personalised medicine and complex therapeutics such as biologics, where molecular interactions need to be measured directly in clinical samples.
Conclusion
As FCS instrumentation becomes more compact, intuitive, and powerful, its role is expanding from the research bench to high-throughput platforms, drug discovery and clinical workflows. The synergy of AI-driven analytics, novel dyes, and translational capabilities is unlocking new frontiers for dynamic molecular science.
FCS is no longer just a tool for diffusion – it is becoming a versatile engine for quantitative insight, molecular discovery, and therapeutic innovation.

Dr Timothy Craggs
Founder & CEO
“FCS and FCCS provide highly quantitative, scalable (high-throughput) approaches to answer key biological and biomedical questions. We are excited to be developing a range of benchtop instruments, assays and benchmarks, for basic research, fluorophore characterisation, drug discovery and early diagnostics.”