PhotonFit
Intuitive, unified
FCS and smFRET analysis software
In the past, my team spent more time troubleshooting open source software packages than actually looking at their data. PhotonFit has completely removed that friction. The interface is intuitive, and the sliding scales for real-time parameter tuning give us immediate confidence in our results. It has turned complex, manual analysis into a same-day discovery session, allowing us to focus on the biology instead of the code.Dr. Janice D. Pata
Director at the Division of Scientific Cores, Wadsworth Center, New York State Department of Health
Single-molecule analysis shouldn't need a specialist to decode it.
First, we streamlined single-molecule acquisition. Now the analysis can be just as effortless.
smFRET and FCS analysis have always been challenging, even for those who are familiar with the data. Researchers shouldn't be losing time to complex workflows, or never exploring experiments because the barrier to entry is too high.
Installation hurdles stall analysis
The dependency of open-source tools creates an immediate barrier to entry. Scientists can spend hours troubleshooting environment setups and ensuring that data files extracted from acquisition software are compatible before a single data point is processed.
Fragmented workflows fracture data
Juggling disconnected notebooks for FRET analysis and correction forces researchers into a cycle of manual data management. This lack of a unified pipeline makes reanalysis difficult and discourages high-throughput exploration and iteration.
Complex code obscures the science
When analysis tools show lines of code instead of biological insights, they alienate everyone but the specialist. This complexity tax prevents non-coders from engaging with single-molecule data, leaving transformative experiments to gather dust.
Manual iteration drains momentum
Static plots and numerical inputs turn parameter tuning into a laborious task. Without the ability to see changes instantly, the friction of fine-tuning thresholds becomes a deterrent to pursuing deeper, more nuanced insights.
A streamlined, script-free workspace for smFRET and FCS
PhotonFit is purpose-built for single-molecule data โ turning raw smFRET and FCS data into publication-ready insights with an easy-to-use, real-time workspace designed for all scientists.
Single-molecule FRET measures the conformations and the conformational dynamics of individual biomolecules directly in solution โ with sub-Angstrom precision and down to ฮผs time resolution.
PhotonFit integrates all you need for this analysis seamlessly.
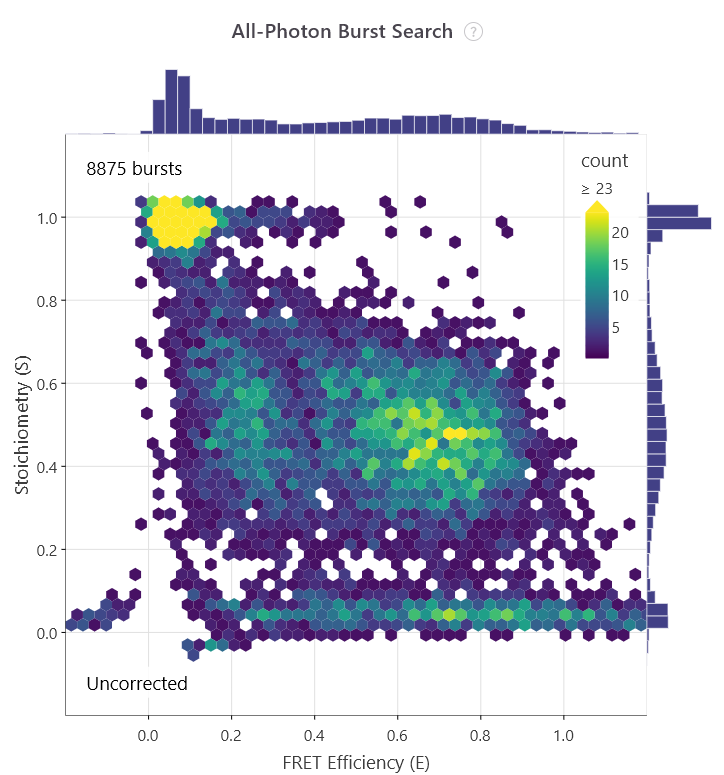
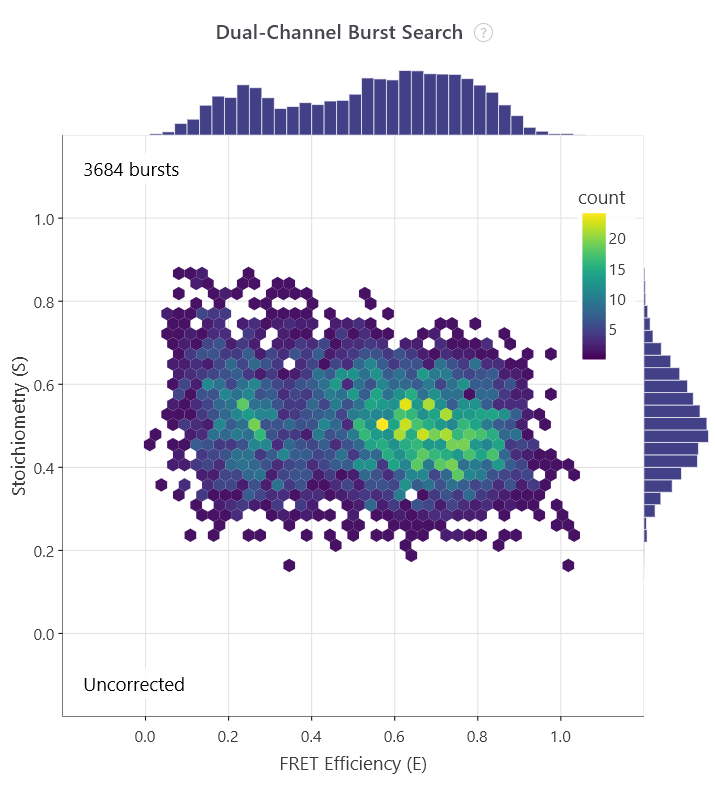
View, filter and analyse raw fluorescence bursts โ smFRET burst analysis with ฮผs-ALEX
Convert raw photon streams into burst-resolved FRET efficiency and stoichiometry, then fit to extract the FRET efficiencies of static sub-populations.
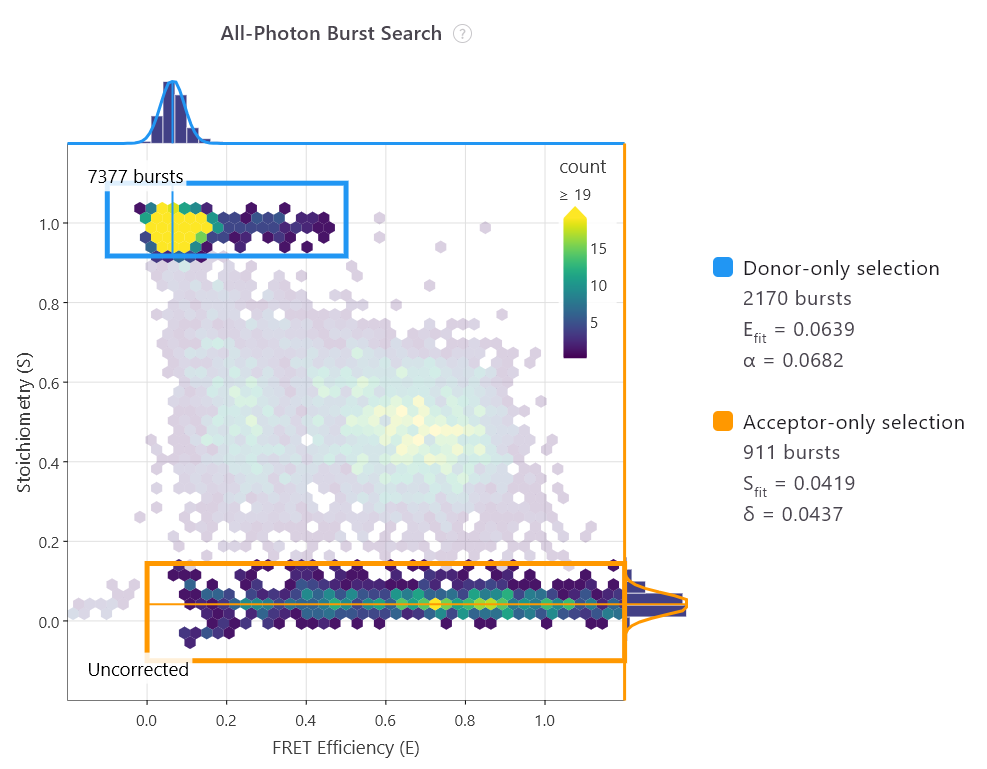
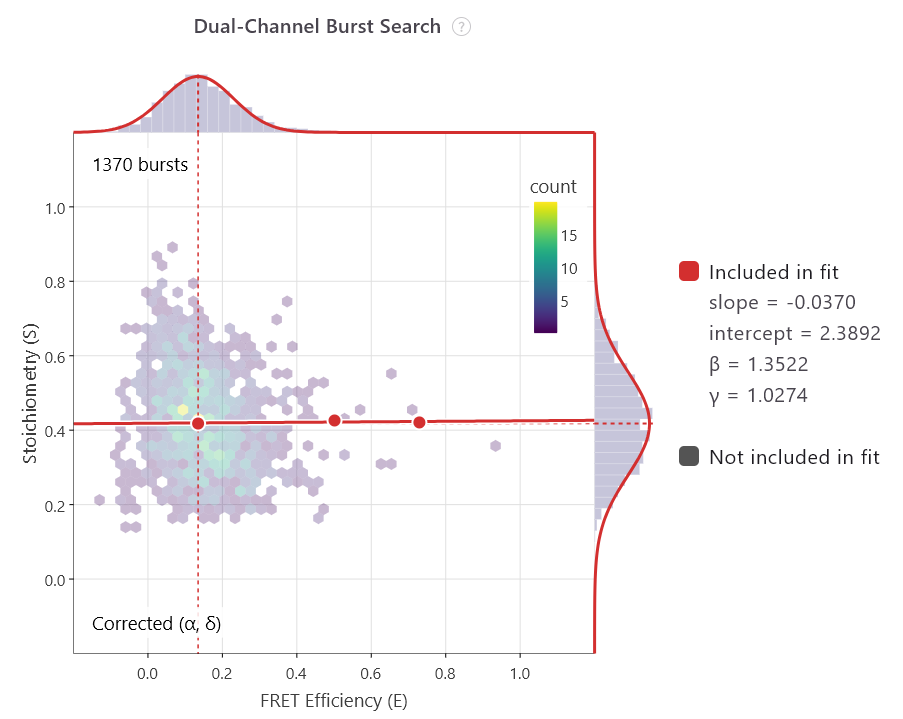
smFRET requires precision โ accurate FRET correction has got you covered
Extract and apply the four correction factors required for accurate FRET: donor spectral leakage (ฮฑ), direct acceptor excitation (ฮด), excitation ratio (ฮฒ) and detection-efficiency ratio (ฮณ).
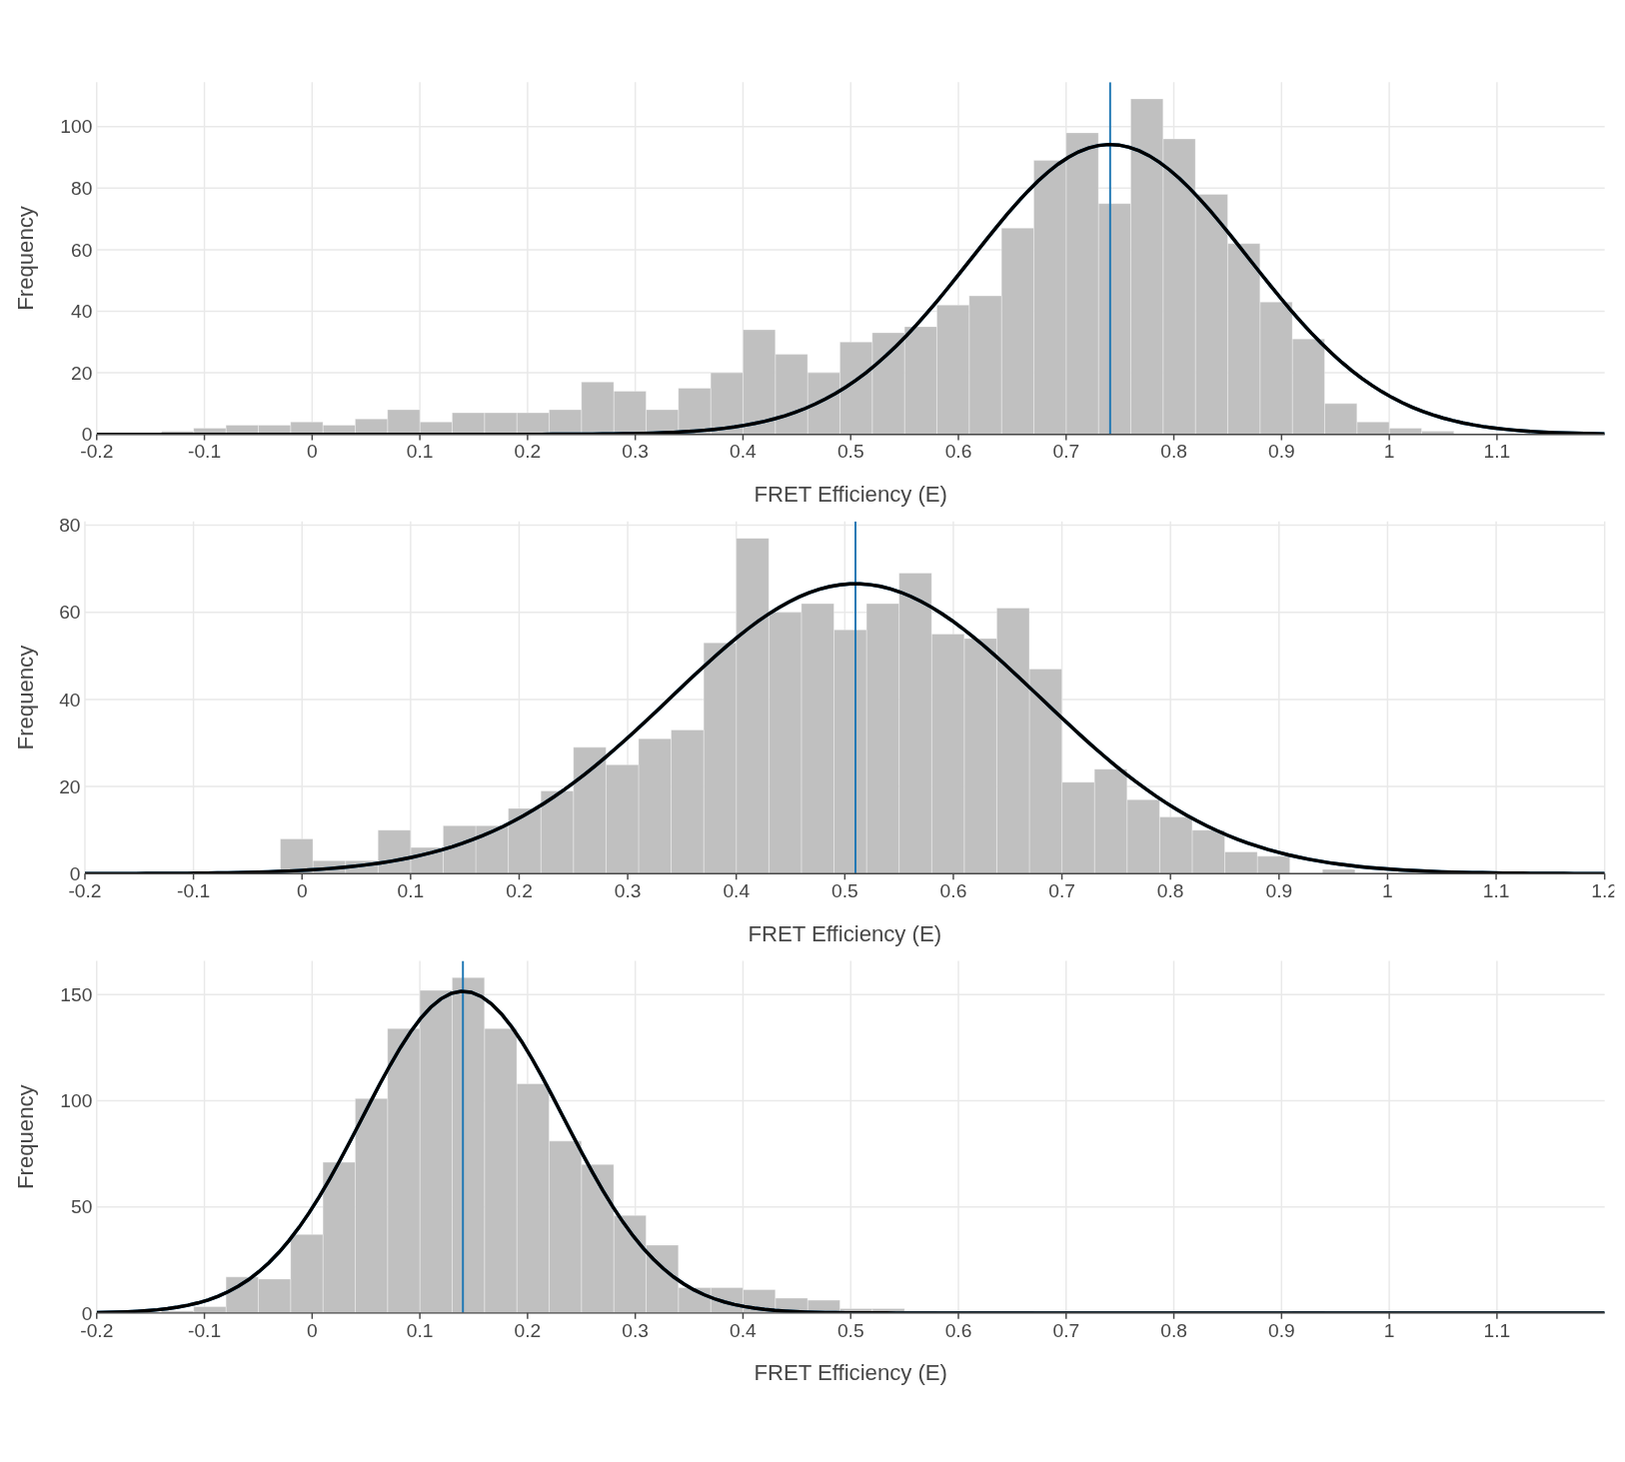
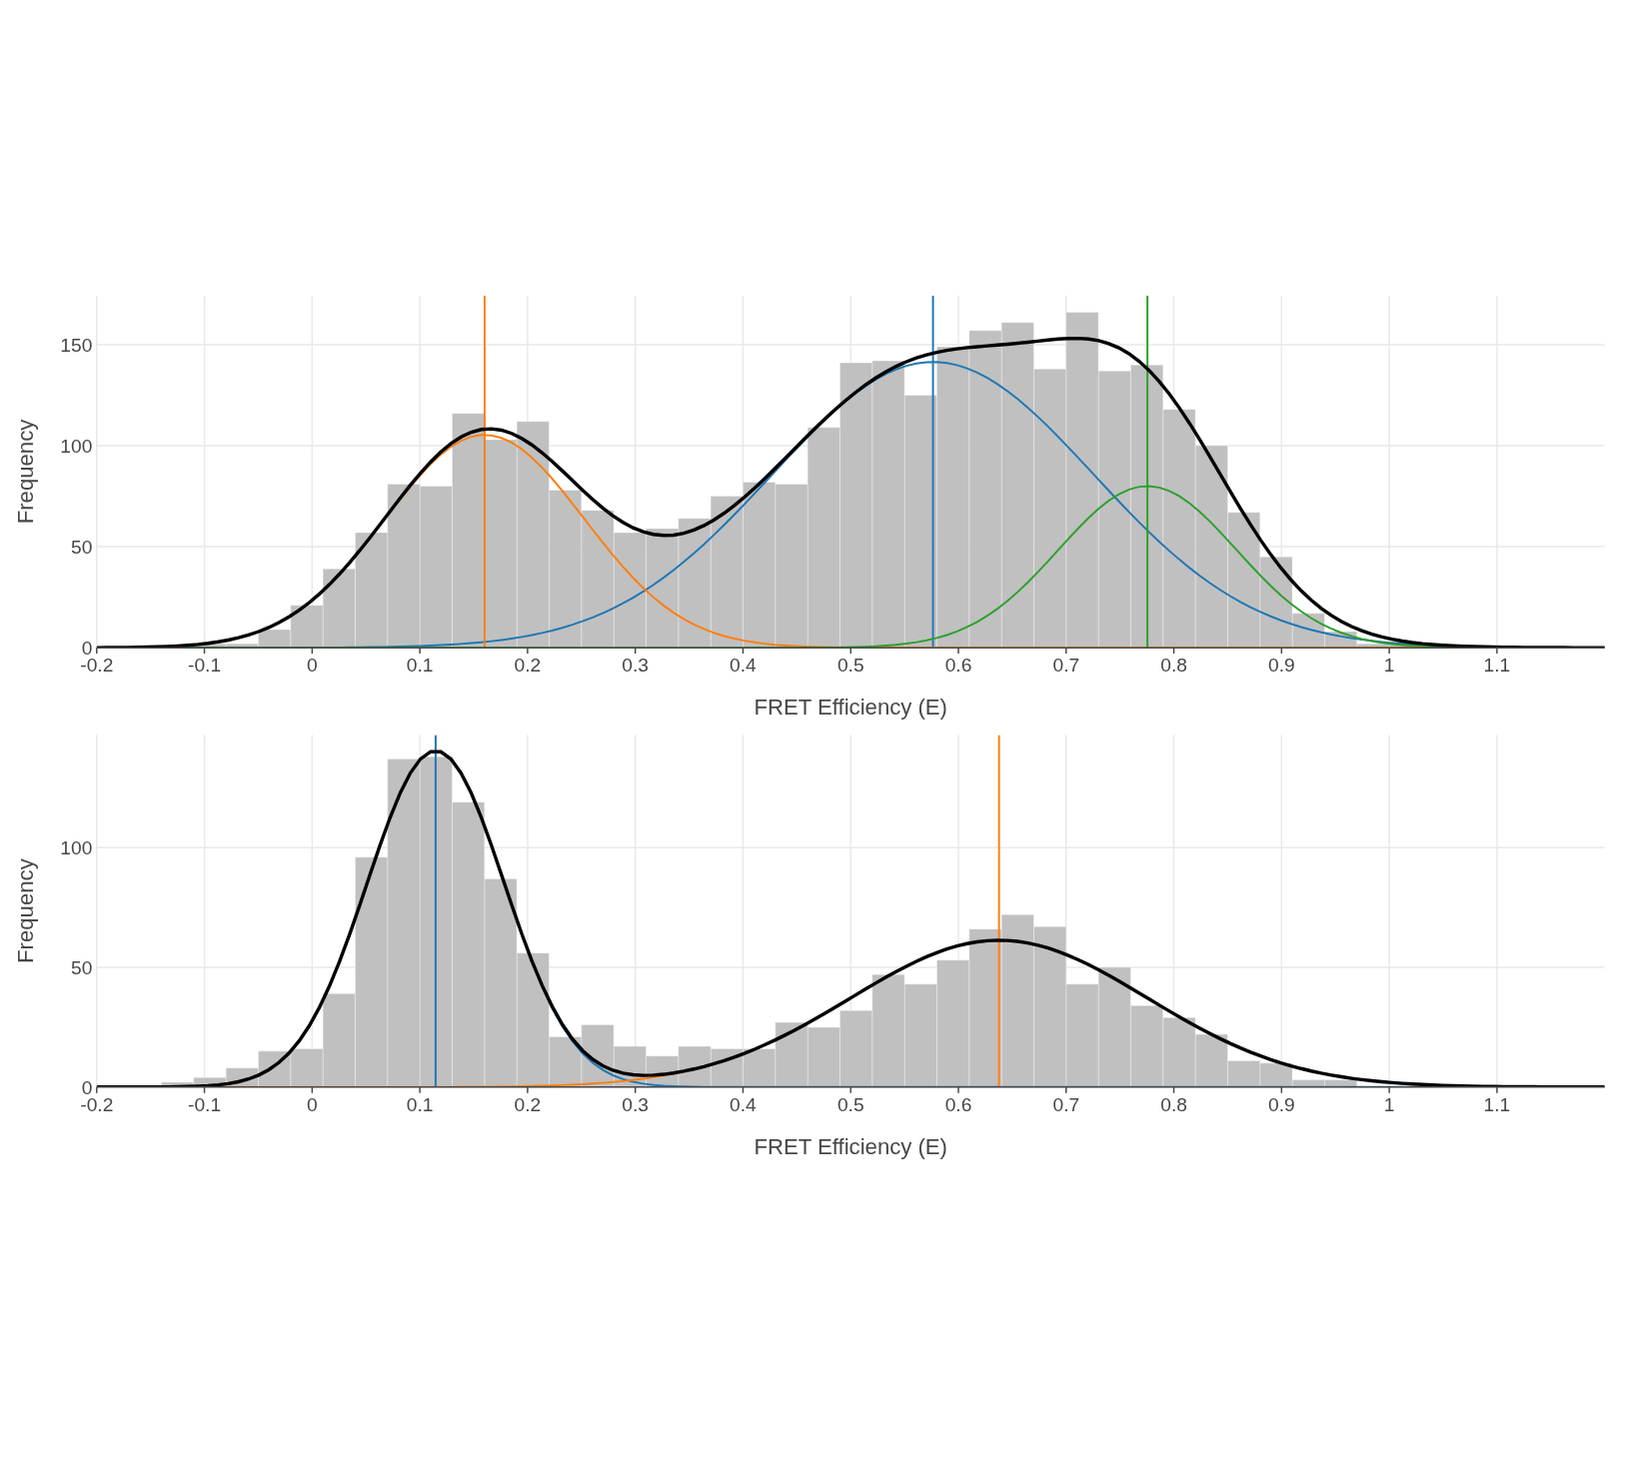
Plot and fit state histograms
PhotonFit allows you to instantly fit state histograms with the respective distribution functions.
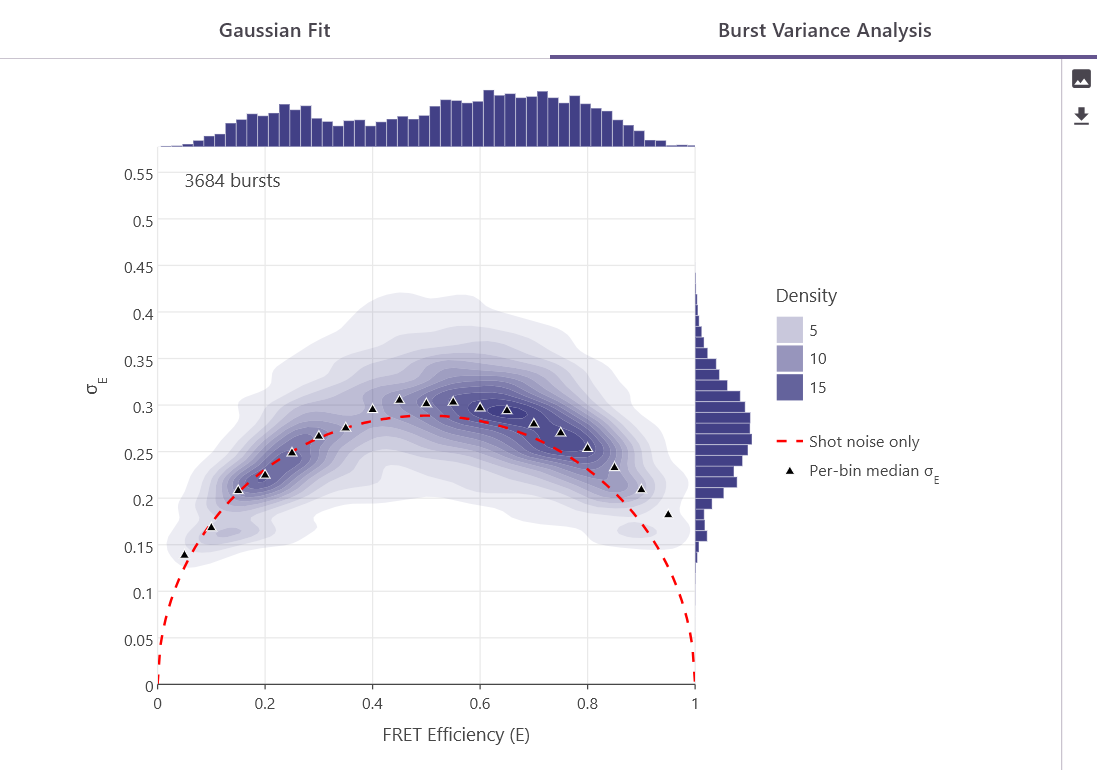
Biomolecules are dynamic โ burst variance analysis helps you to assess these properties
Distinguish static from dynamic FRET populations by testing whether the within-burst FRET efficiency variance exceeds shot noise.
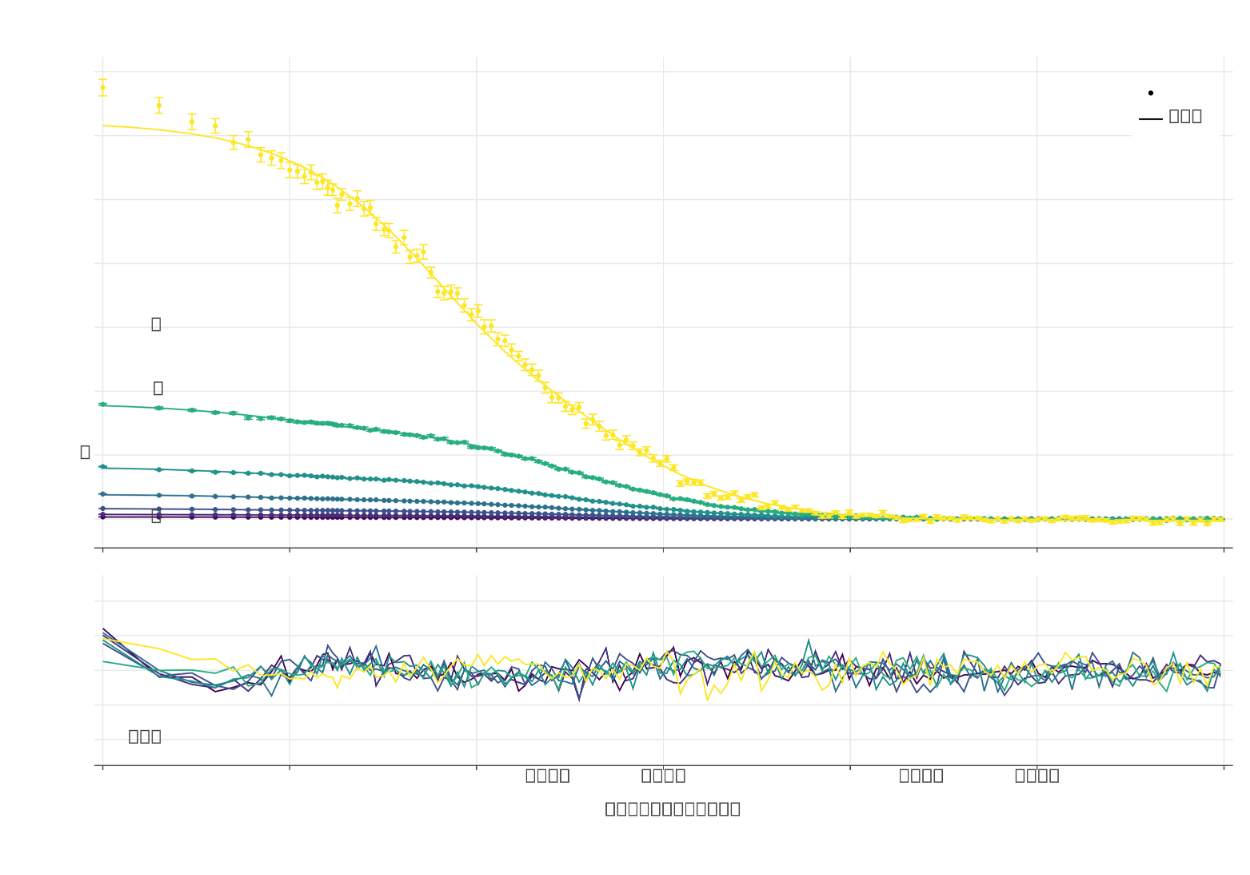
Fluorescence correlation spectroscopy allows to characterise binding interactions by directly measuring molecular diffusion via fluorescence fluctuations. PhotonFit enables you to transform the raw fluorescence signals into correlation curves, to fit them adequately, to extract diffusion coefficients, molecular sizes as well as single- and dual colour binding curves.
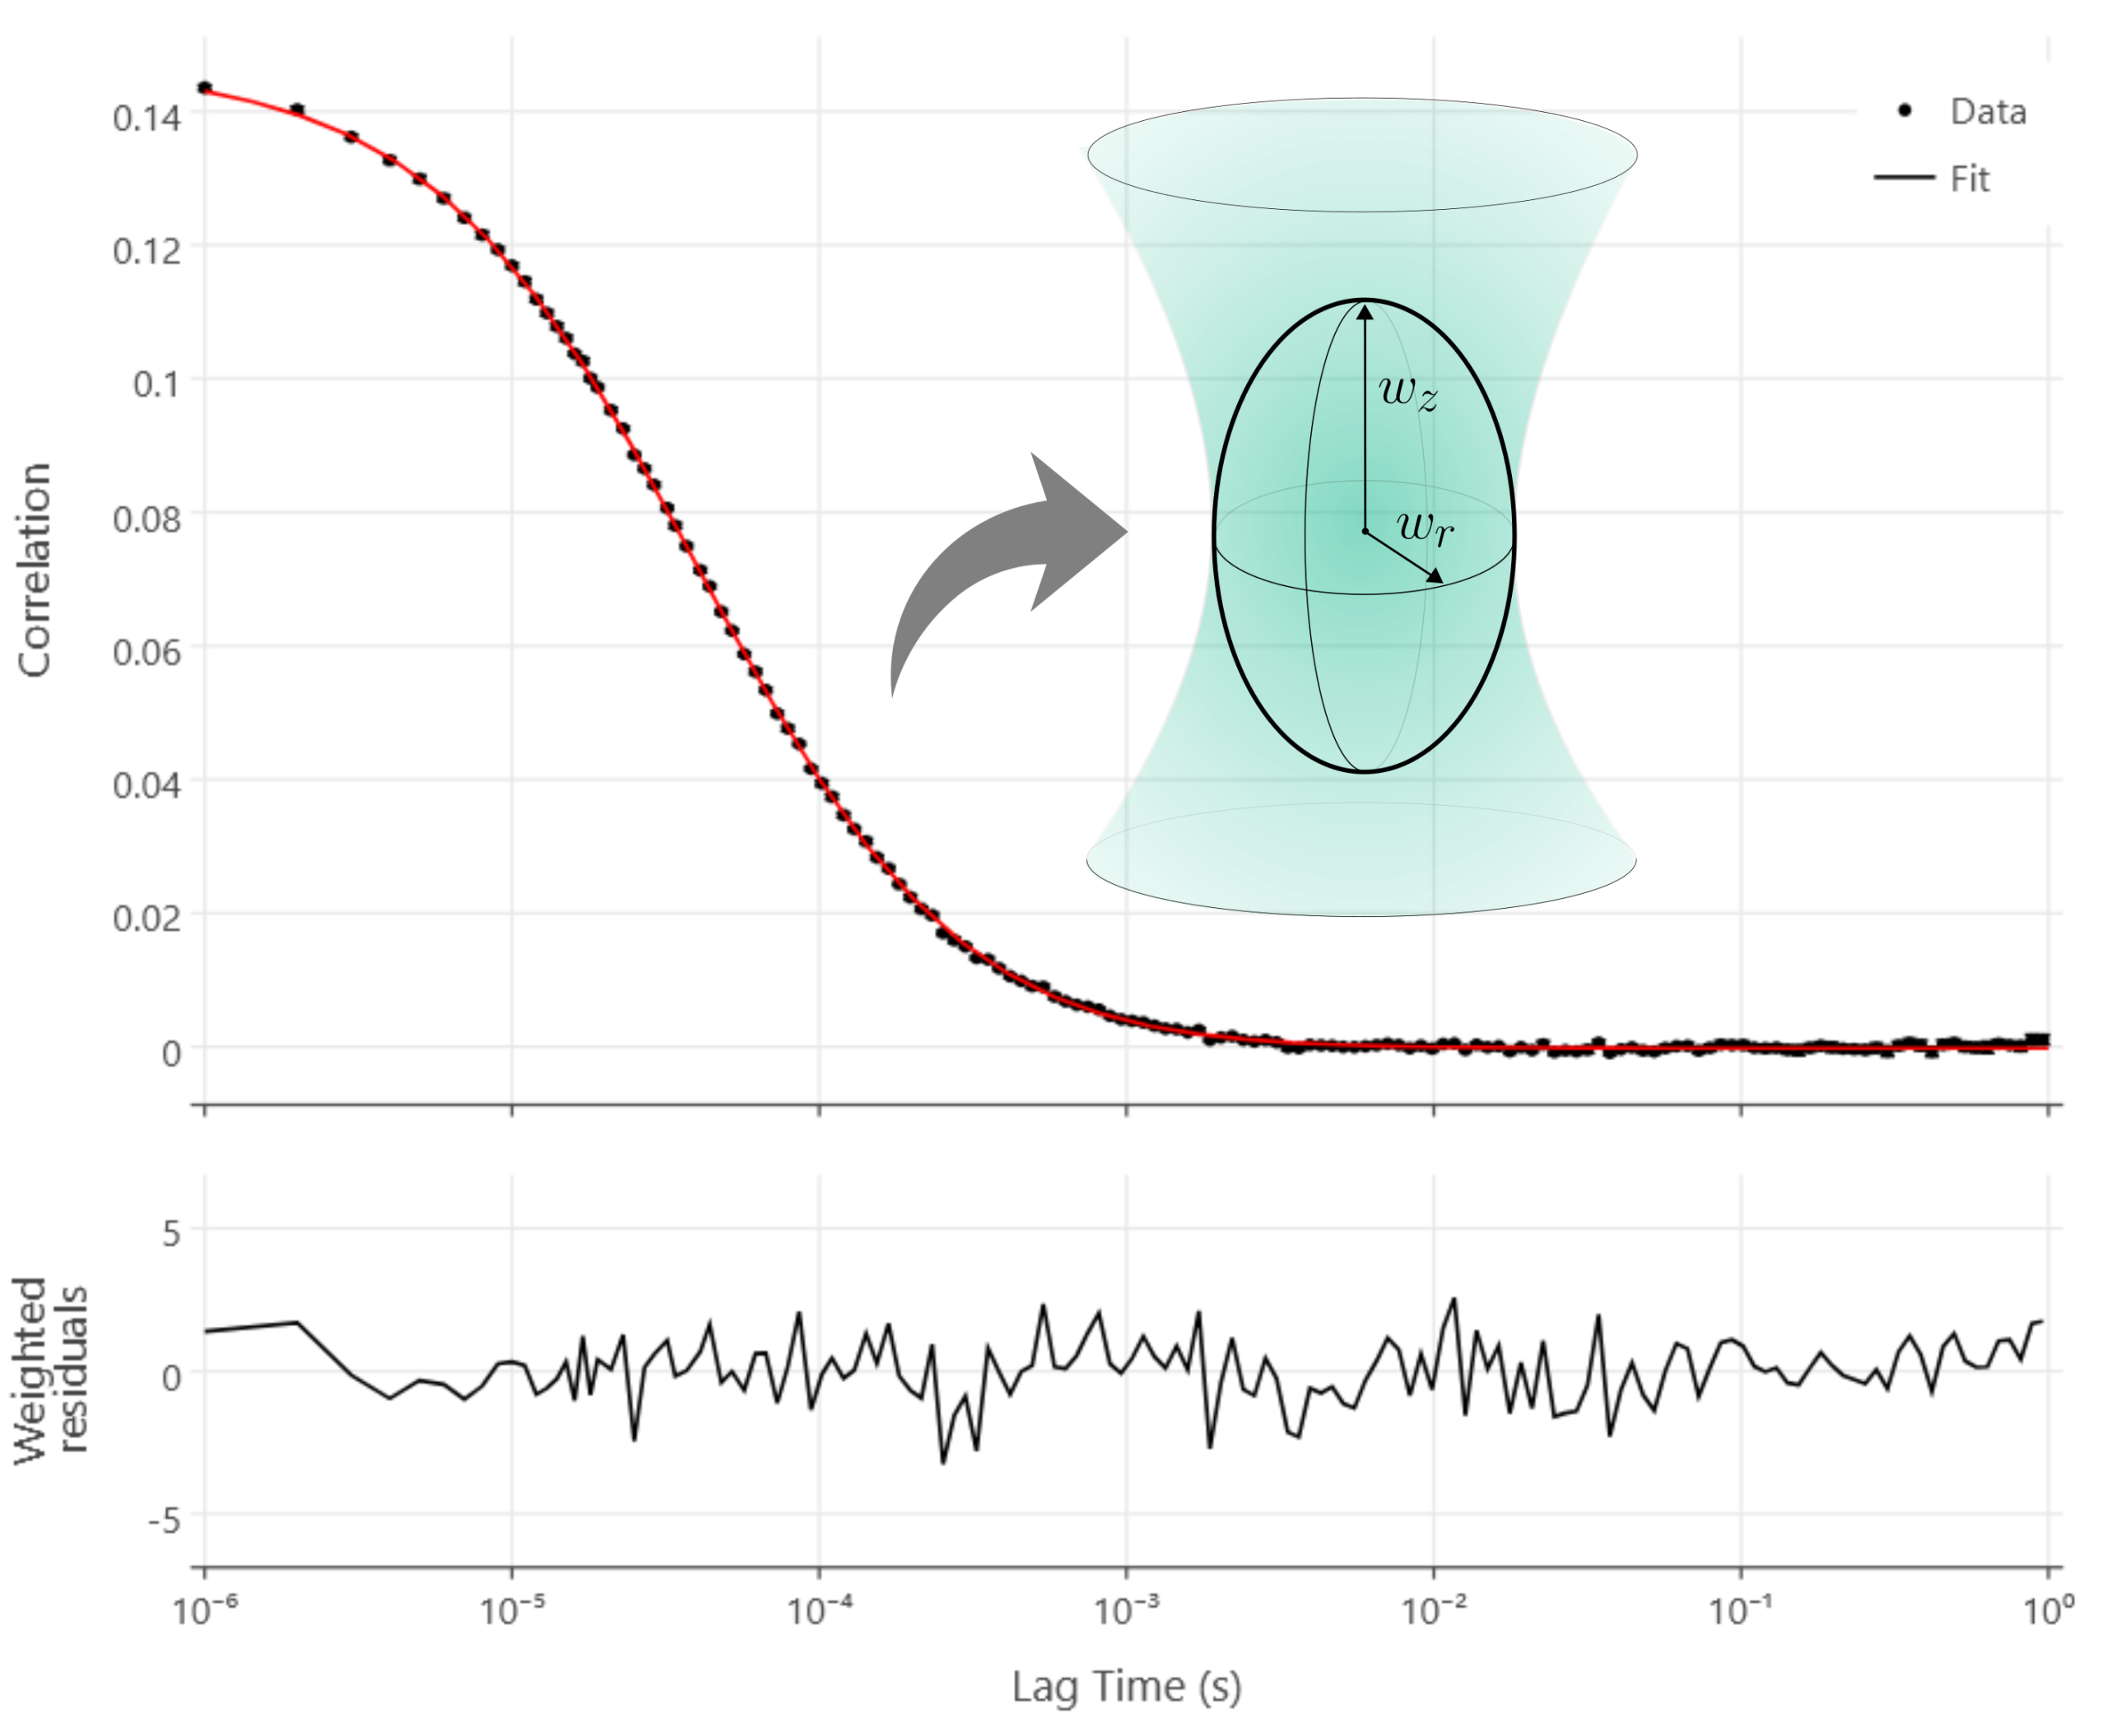
Calibrate your confocal volume
Determine the confocal detection volume from an FCS measurement of a reference dye, calibrating downstream FCS measurements of concentration and diffusion.
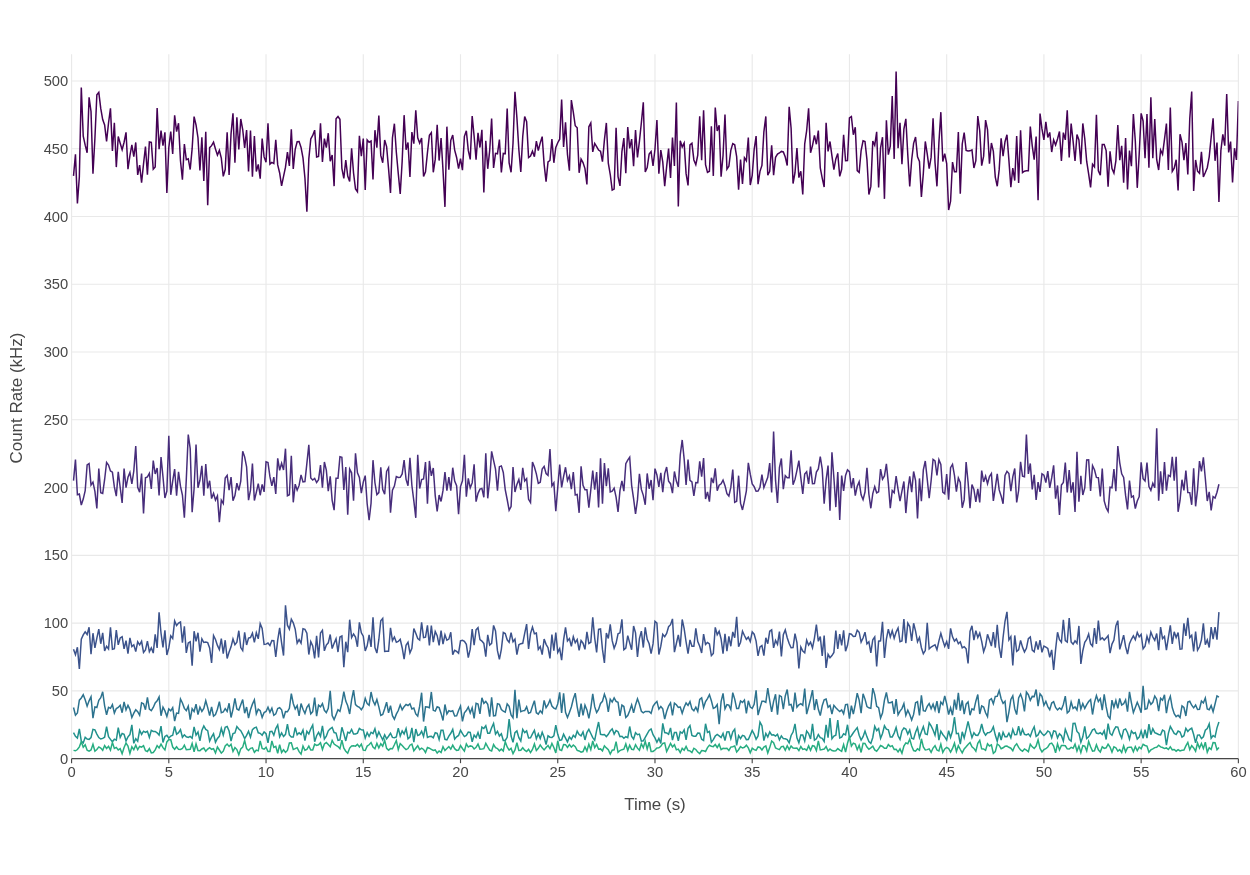
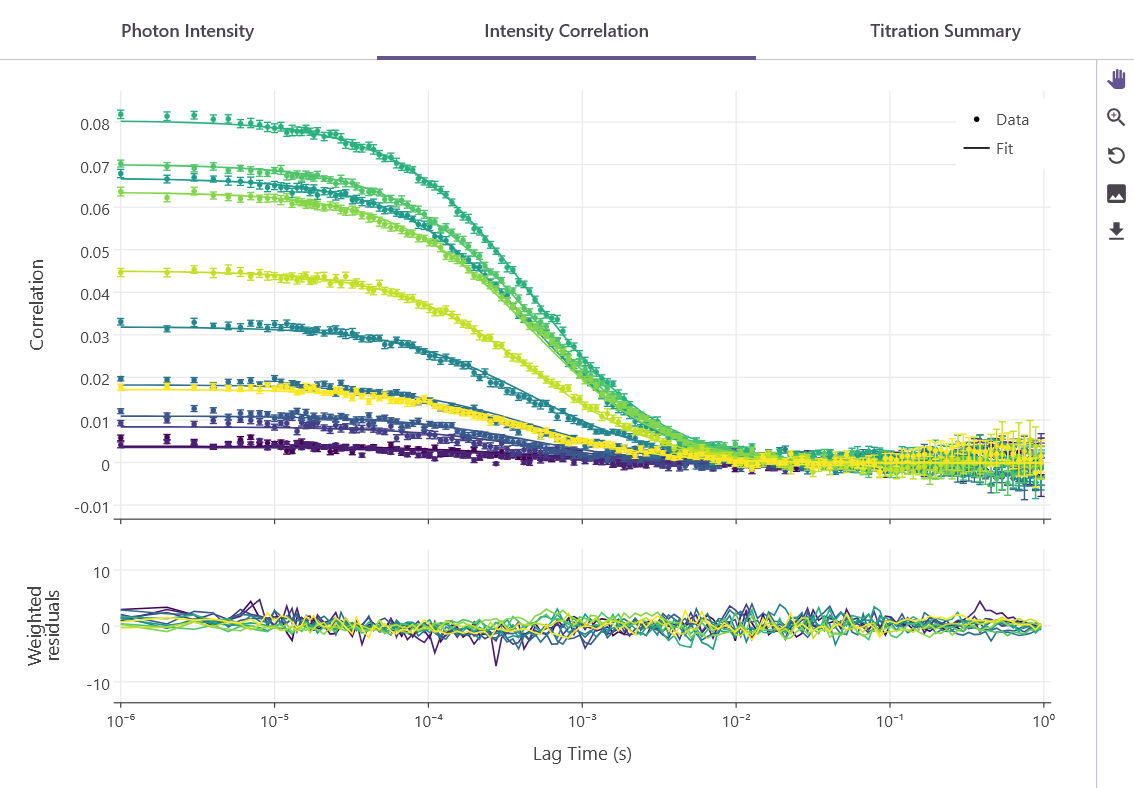
Transform fluorescence fluctuations of your molecules into correlation curves
View fluctuation traces alongside their computed correlation curves, linking raw photon signal directly to the autocorrelation output.
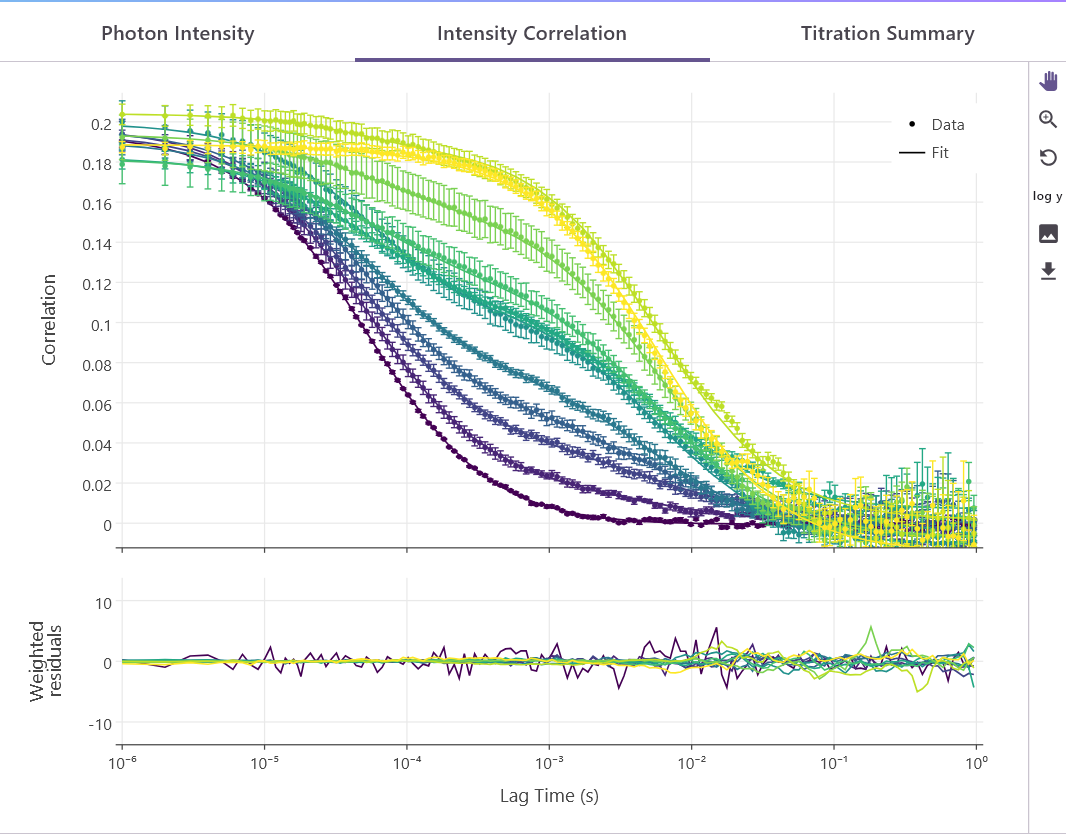
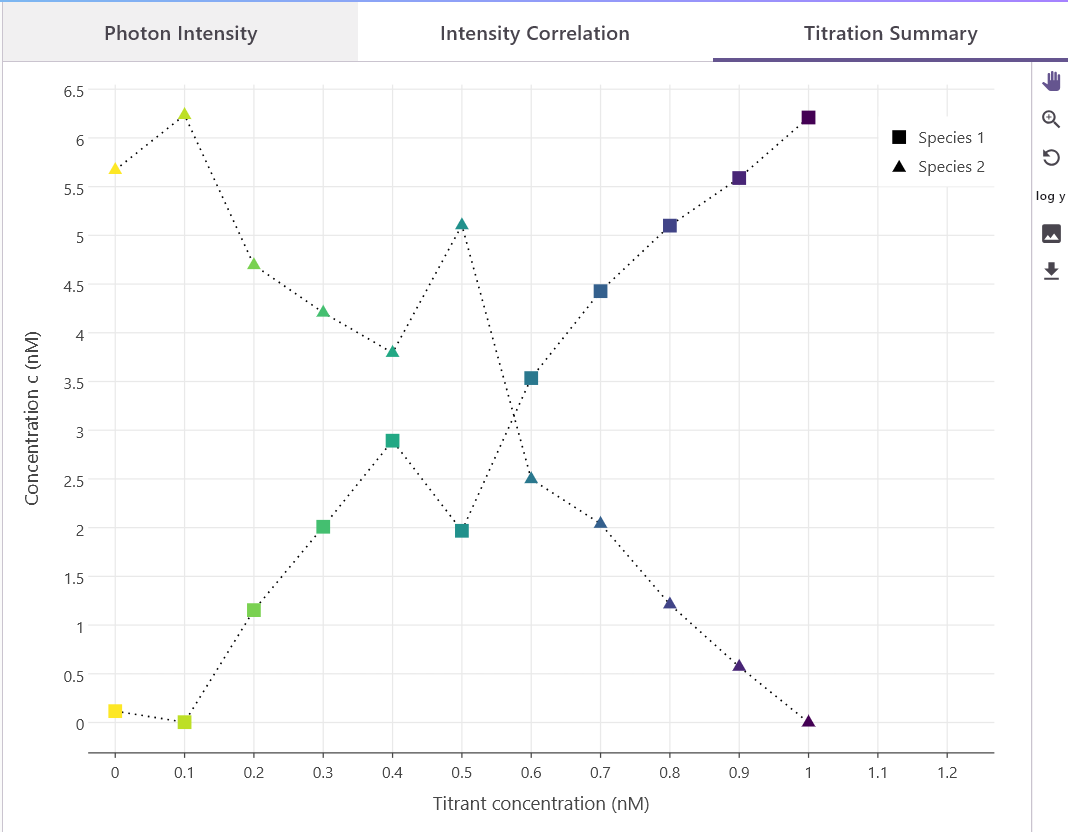
Characterise binary binding reactions โ single-colour FCS binding titration
Resolve binding-induced diffusion shifts across a single-colour titration series, producing exportable curves ready for downstream Kd analysis.
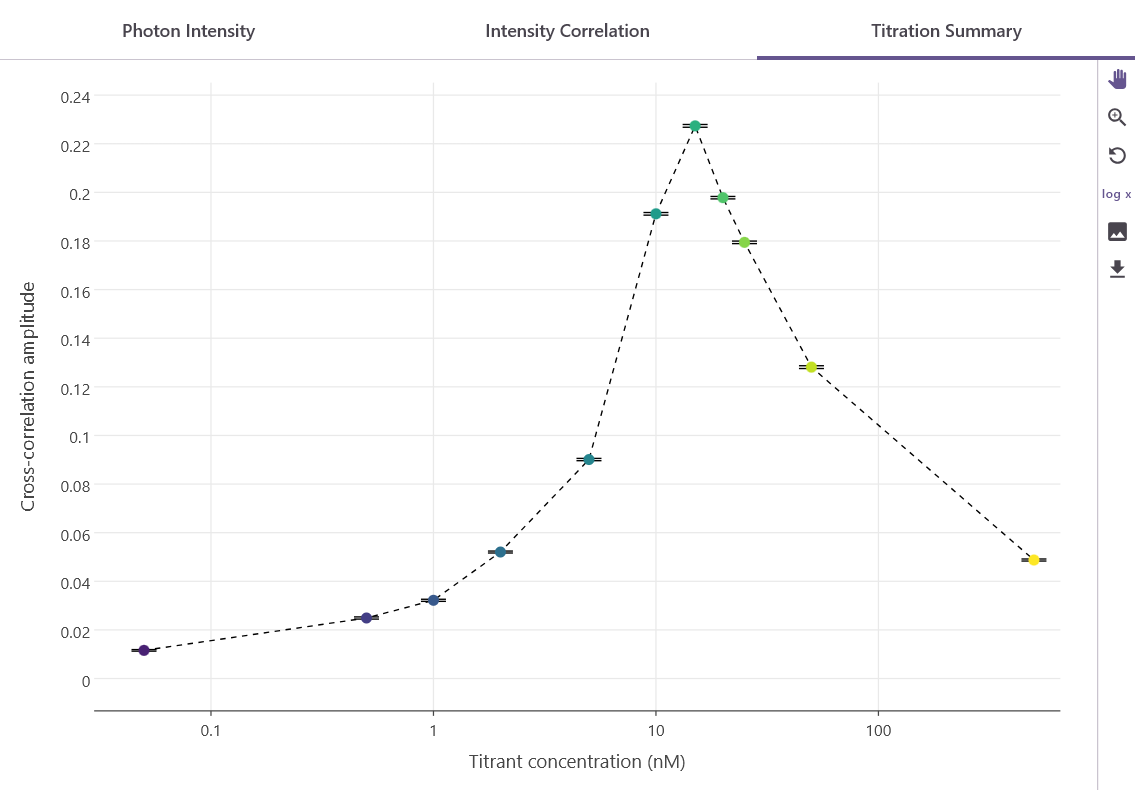
Measure ternary complex formation โ dual-colour FCCS binding titration
Cross-correlate dual-channel photon streams to quantify co-diffusion across a titration series, with spectral-crosstalk correction and exportable curves ready for downstream Kd analysis.
Why teams choose PhotonFit
Teams choose PhotonFit because it makes FCS and smFRET data analysis faster, easier, and more reproducible. As a unified FCS and smFRET analysis software platform, PhotonFit streamlines data processing, visualisation, and publication-ready figure generation for single-molecule fluorescence experiments.
Go from sample to insight in minutes
No setup, no coding, no terminal commands โ just start analysing immediately in a ready-to-use environment designed for both biophysicists and biochemists.
Discover insights in real-time
Use intuitive controls to explore and refine your data instantly โ no more slow, manual iteration, just fast, confident analysis.
Stop switching between tools
Analyse smFRET and FCS in one seamless workflow โ no disconnected notebooks, no cluttered software, just everything in one place.
See patterns across samples instantly
Compare results side-by-side and generate insights in real time โ without exporting data or rebuilding plots in external tools.
Focus on your science, not the software
Work in a clean, distraction-free interface that removes complexity, so you can perform advanced analysis with clarity and confidence.
Go from raw data to final figures
Export high-quality visuals and complete datasets in seconds, ready for sharing, reporting, and publication without extra work.
A complete toolkit for smFRET and FCS
We've built an ecosystem that covers the entire single-molecule experiment โ from its inception, to the data acquisition and the final data export. Because EI-Analysis is developed alongside our hardware and supported by our team of specialists, you get a level of consistency and expert guidance that brings single-molecule insights to the entire scientific community.
System
File Types
Community
Software
Software
Packages
and Standards
Support
Concept Runs
Designed for EI-FLEX and EI-FLEX Pro
Data files generated by the integrated EI-Acquisition software are compatible with the EI-Analysis software for streamlined experiments.
The HDF5 advantage
Data isn't trapped in a proprietary silo. By using HDF5 file formats, your single-molecule results are immediately ready for open-source analysis packages, AI-driven pipelines, and cross-platform collaboration, without losing crucial metadata that gives the science context.
Backed by a world-class community
Access to Exciting Seminars, case studies, and a growing network of single-molecule researchers using the same platform โ all complemented by decades of expertise.
End-to-end support from our experts
Our single-molecule experts are always happy to support you at any stage of your Exciting journey โ whether you're a biochemist discovering FCS for the first time, or a seasoned biophysicist ready to complement your structural toolkit and streamline your analysis.
Ready to see your molecules
in real time?
Book a personalised demo with our team and discover how simple single-molecule analysis can be.